


Good morning. We’ve done “nutshell” portraits of Nova Scotia, Alberta and British Columbia. Now, on to the greatest province of them all, the only one that shot its way into Confederation, Manitoba.
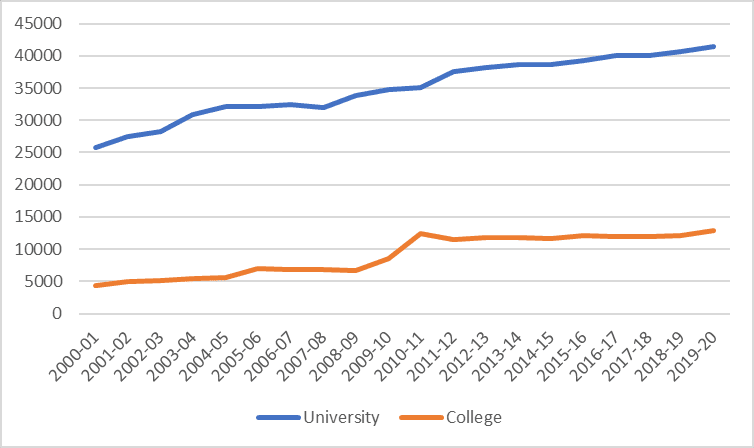
Let’s start with student numbers. Manitoba has seen slow but steady growth on the university side, with numbers growing from 25,000 to 40,000 between 2001 and 2020 With colleges, it is hard to be exact about growth rates since a substantial portion of the increase shown here was in fact due to changing Statistics Canada definitions of what constitutes “college” education and what constitutes “vocational education”. However, in general college enrolments have increased as well, albeit perhaps not by as much as the data in Figure 1 would imply.
Figure 1: Full-time Equivalent Students, by Sector, 2000-01 to 2019-20
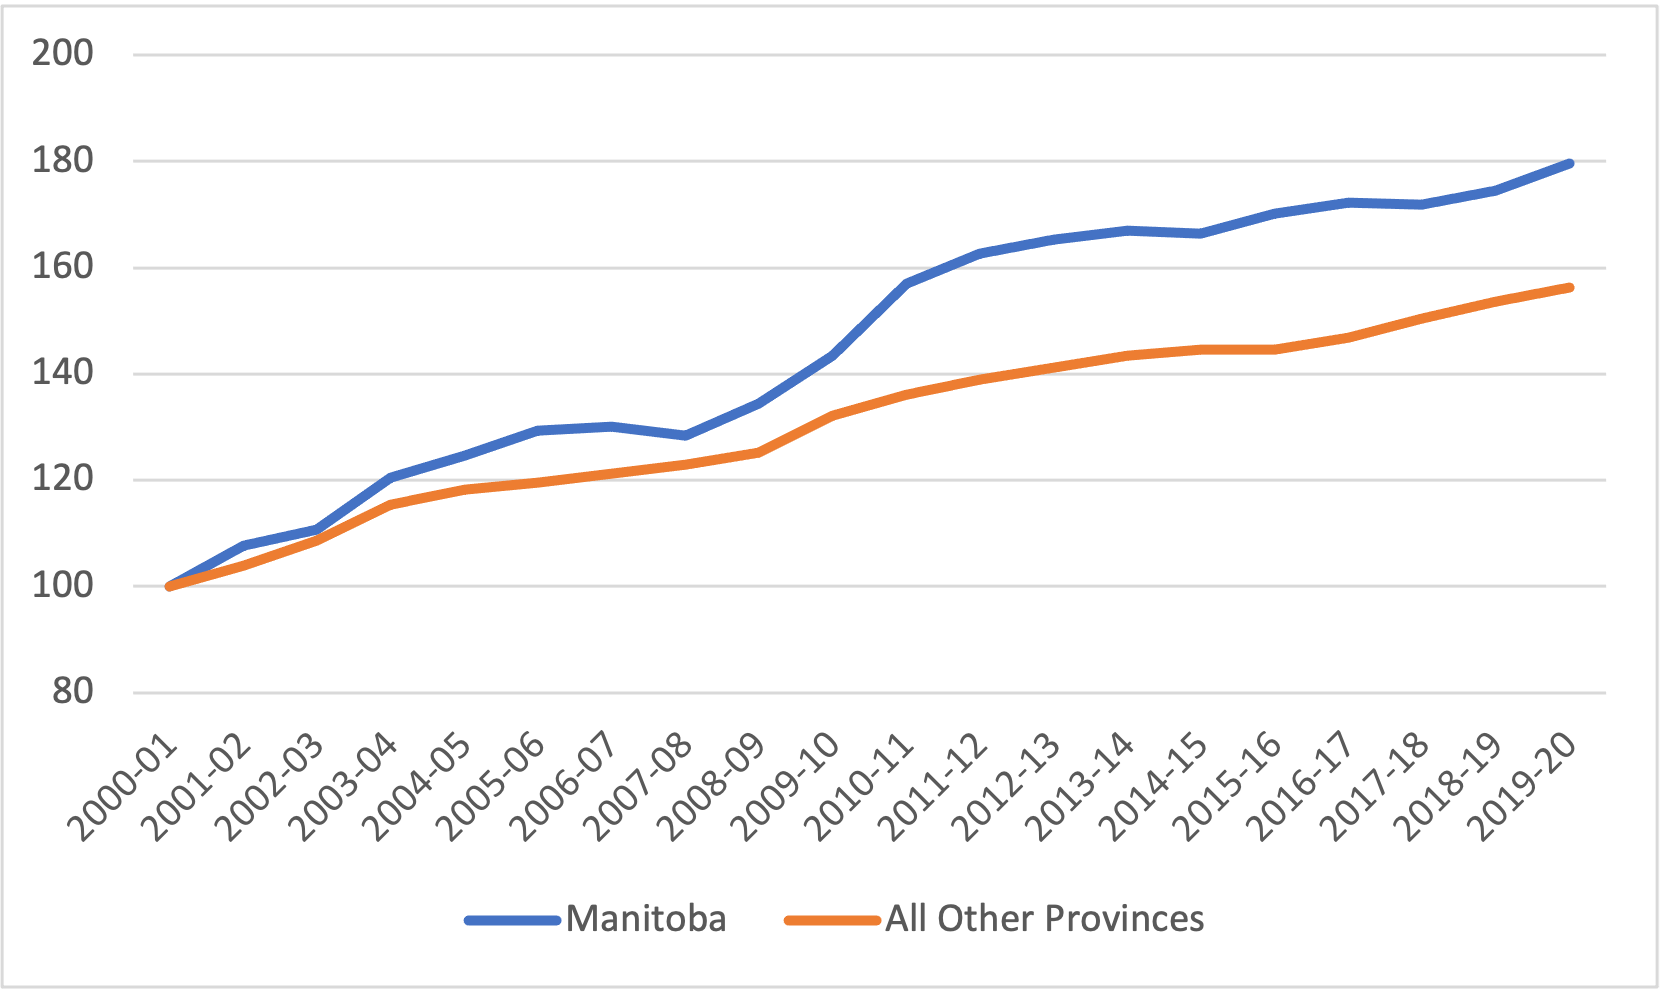
Historically, Manitoba has tended to have fewer post-secondary seats relative to population than other provinces. However, since 2000, growth in enrolments in Manitoba have outpacedthose in the rest of the country (although given the oddities in the college data, the gap might not be quite as large as Figure 2 suggests).
Figure 2: Indexed Full-Time Equivalent Post-Secondary Students, Manitoba vs Other 9 Provinces, 2000-01 to 2019-20 (2000-01 = 100)
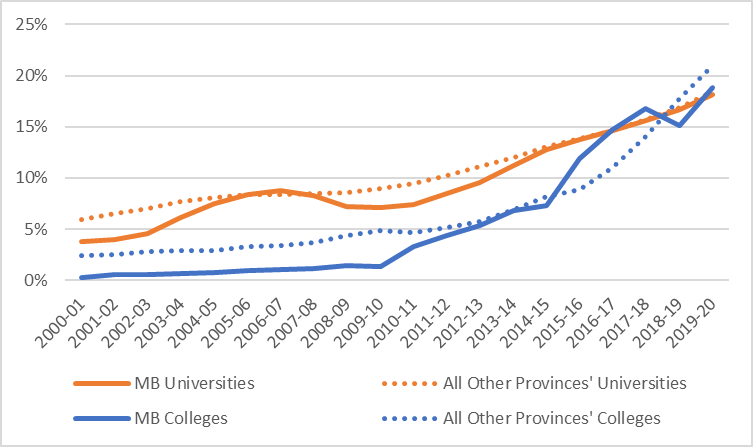
Manitoba has for most of the past twenty years lagged the national average in terms of international student enrolment. However, in recent years, the province has caught up to the rest of the country. At both universities and colleges international students make 18-19% of the student body, almost exactly equal to the national average.
Figure 3: Proportion of Students from Outside Canada, by Sector, Manitoba vs other 9 provinces, 2000-01 to 2019-20 (2000-01 = 100)
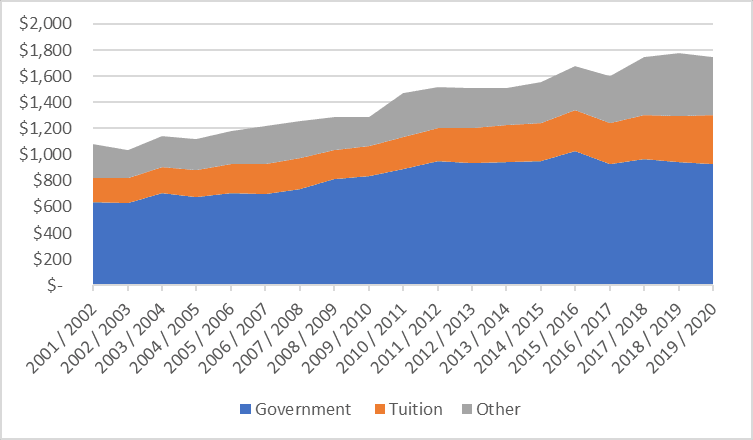
Manitoba’s level of public institutional funding is above the national average, and income from tuition – even international tuition – remains below the national average (international tuition in Manitoba is significantly lower than in other provinces). Public funding was at its highest in 2015-16, since which time it has declined by 9% after inflation is taken into account. Total funding in 2019-20 was 62% higher than in 2001-02; however, since student numbers were up by nearly 80%, this implies a drop in total per-student income over this period.
Figure 4: Total PSE Institutional Revenue by Source, Manitoba, 2000-01 to 2019-20, in millions of constant $2019
As Figure 5 shows, overall growth in levels of public funding from government in Manitoba was higher than in the rest of the country until about 2015, after which point it fell back to roughly the national average. On the other hand, tuition income has risen less quickly in Manitoba than elsewhere. As Figure 6 shows, this is largely because domestic tuition fees have remained well below national levels for the entirety of the last two decades.
Figure 5: Indexed Change in Institutional Income from Governments and Tuition Fees, Manitoba v. Other 9 Provinces, 2000-01 to 2019-2020 (2000-01 = 100)
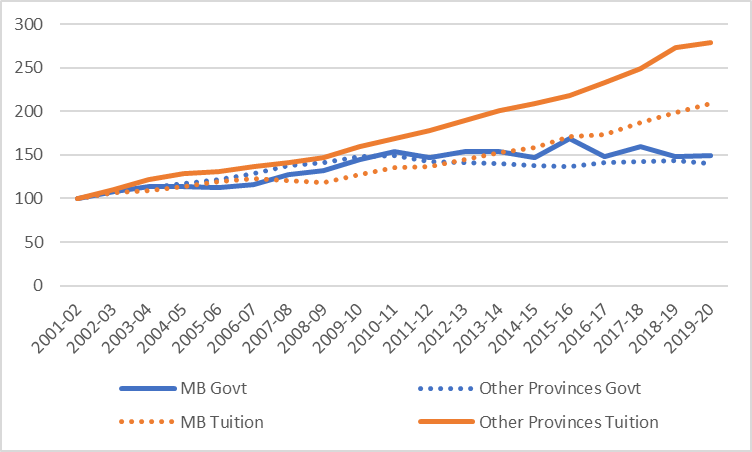
Figure 6: Tuition Fees, Manitoba v. Canada, 2006-07 to 2021-22 (in constant $2021)
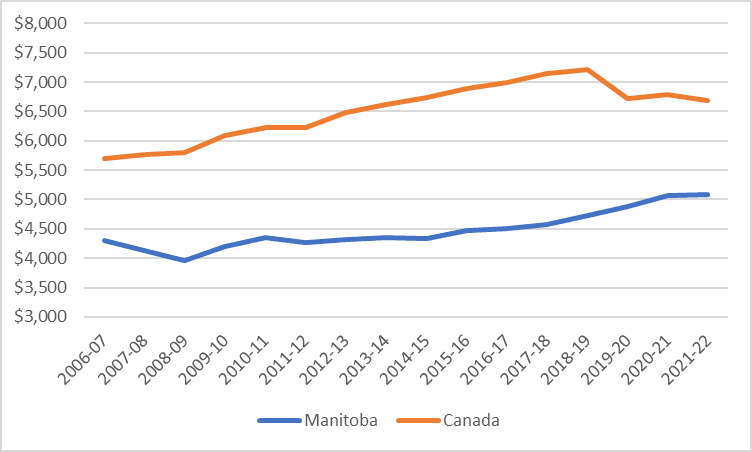
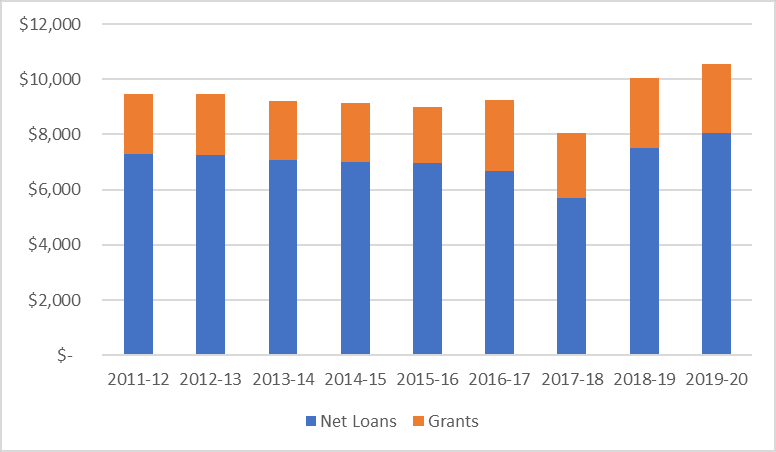
Figure 7 shows the average loan per recipient plus average grant per recipient over time in Manitoba, from both provincial and federal sources (this is not quite the same as an average aid package because not all loan recipients also receive grants). Manitoba students have lower levels of borrowing than other provinces, not just because tuition is low, but also because the cost of living is lower and a high percentage of students in Manitoba live with their parents, both factors which tend to reduce need and hence borrowing. Overall aid packages are a smidge over $10,000 per year, with grants making up about 25% of total aid.
Figure 7: Average Loan Plus Average Grant Disbursed, Manitoba, 2011-12 to 2019-20, in constant $2019
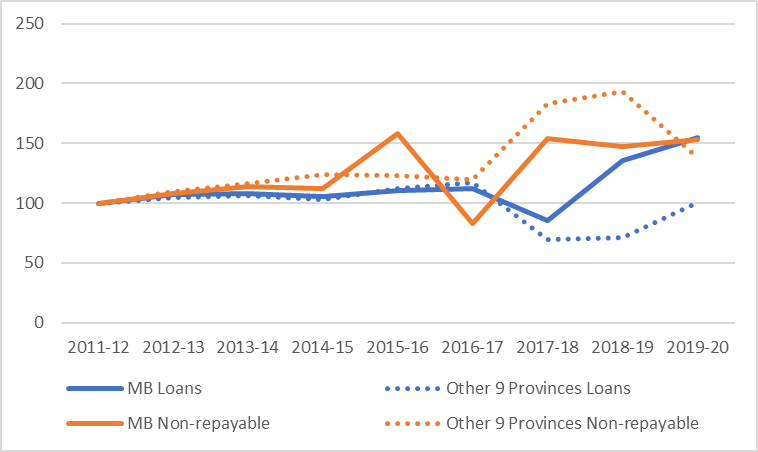
Over the past 10 years, non-repayable assistance in Manitoba has increased at a rate close to the national average. However, lending has increased more quickly, albeit from a lower base.
Figure 8: Indexed Change in Total Real Provincial Loans and Grants Disbursed, Manitoba vs. Other 9 Provinces, 2011-12 to 2019-20 (2011-12 = 100)
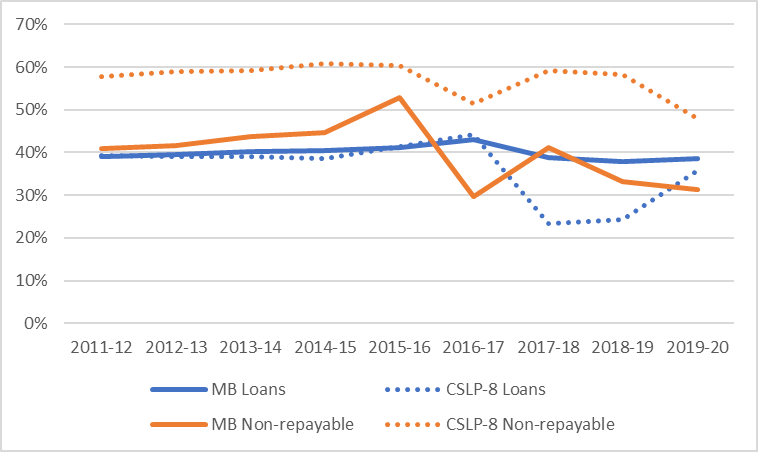
Finally, Figure 9 looks at how much of the province’s student assistance comes from provincial as opposed to federal sources. For this exercise, I compare Manitoba to the other eight provinces which participate in the Canada Student Loans Program, again excluding Quebec. What we see in this figure is that where loans are concerned, Manitoba contributes roughly the same proportion as other provinces (that is, about 40% of the total); however, with respect to grants, it issues a considerably smaller proportion (30% vs 50% in the rest of the CSLP-zone). In a sense, the province can get away with this because the total amount of loans is relatively low – because of this, even though the province arguably under-invests in grants, student debt remains lower than elsewhere in the country.
Figure 9: Provincially-Funded Loans and Grants Disbursed as a Percentage of Total Loans and Grants Disbursed, Manitoba vs. 8 other Canada Student Loans Program Provinces, 2011-12
Four provinces down, six to go. Stay tuned for New Brunswick (an outlier province in more ways than one), but tomorrow I’ll be shifting over talk a bit about some surprising news in the world of rankings.

