


A couple of weeks ago, I told you I’d be doing statistical portraits of various provinces over the next few weeks. I started with Nova Scotia (where I spent some great days at the CICan national conference and seeing folks at various Halifax universities, and incidentally, congratulations to Joël Dickinson on her new appointment as President at Mount Saint Vincent University), and then asked for some advice about which province to do next. The response was overwhelming: you wanted to see Alberta. So, here we go.
Let’s start with student numbers. As Figure 1 shows, Alberta institutions have been growing significantly over the past couple of decades, in both the college and university sectors. The one slight complication in the Alberta data is that two very significant institutions – Mount Royal in Calgary and MacEwan in Edmonton – were re-classified as universities in 2008-09. This makes it look as though there was a big switch from college to university study when in fact at an institutional level, growth was relatively smooth throughout the period.
Figure 1: Full-Time Equivalent Students, by Sector, Alberta, 2000-01 to 2019-20
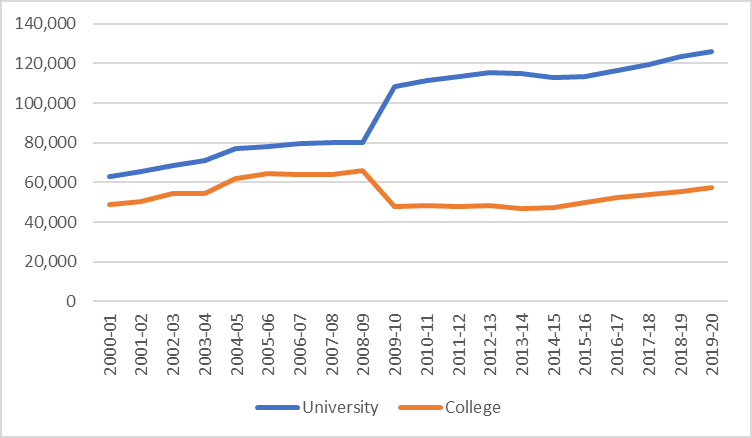
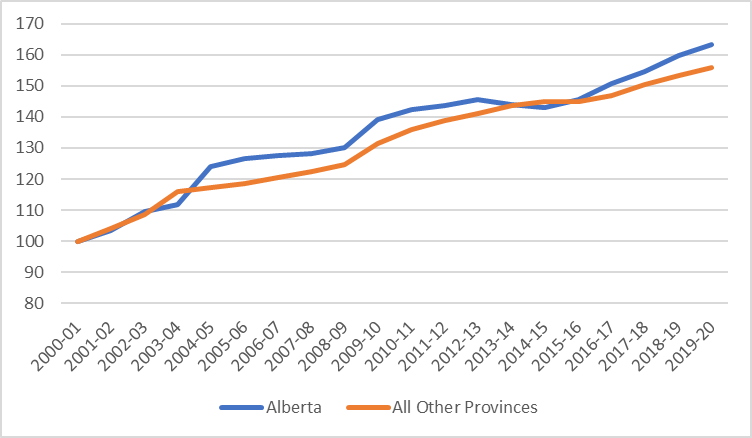
Growth in overall student numbers in Alberta was similar to growth across the country as a whole: an increase in FTE enrolment of 63% over the period 2000-01 to 2019-20. The province’s annual growth rate was somewhat less smooth than that of the rest of the country – Alberta experienced a few years of near-zero growth during years of high oil prices – but over the long term, the increases balanced out.
Figure 2: Indexed Full-Time Equivalent Post-Secondary Students, Alberta vs Other 9 Provinces, 2000-01 to 2019-20 (2000-01 = 100)
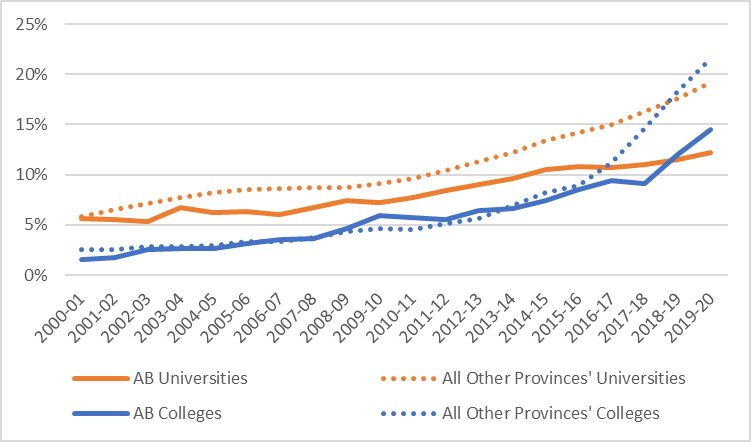
As in other provinces, the percentage of students from outside of Canada has grown substantially over the past few years. In total, 13% of students in the province are international students, (12% in the university sector, 15% in the college sector). However, growth rates for international students lagged those in the rest of the country in the latter half of the past decade. With its lower housing costs, Alberta may be one of the few provinces where international student numbers may still have a little ways to grow.
Figure 3: Proportion of Students from Outside Canada, by Sector, Alberta vs other 9 provinces, 2000-01 to 2019-20 (2000-01 = 100)
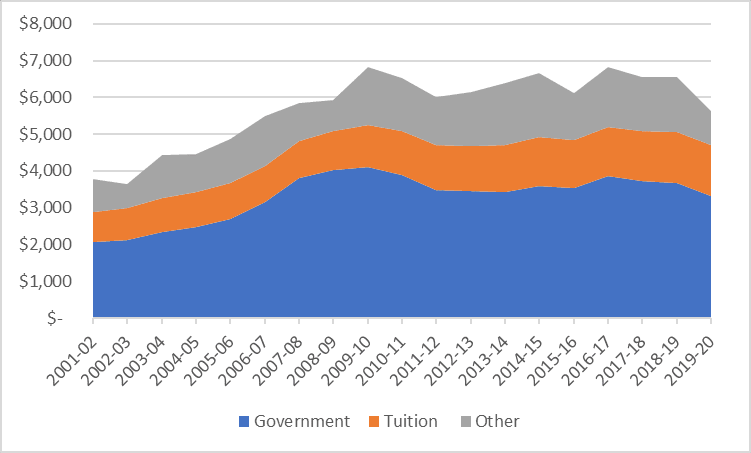
Turning to institutional funding (Figure 4), we see that total income roughly doubled in real dollars between 2002-03 and 2009-10, from $3.6 billion to $6.8 billion. Funding from governments grew in similar proportions, rising from just over $2 billion in 2001-02 to over $4 billion in 2009-10. This was far in excess of student number growth: as a result, Alberta institutions on a per-student basis became by far the best-financed in the country. However, Alberta institutions never again reached these kinds of levels. In real terms, total income bounced between $6.2 and $6.8 billion for another decade before falling before $6 billion in the first year of the UCP government in 2019-20.
Figure 4: Total PSE Institutional Revenue by Source, Alberta, 2000-01 to 2019-20, in millions of constant $2019
As Figure 5 shows, Alberta’s funding pattern since 2001-02 has been quite different than the national norm. As of 2019-20, the real increase in public funding to institutions was much higher in Alberta than it was in the rest of the country (though this would not be true if the line could be extended a couple of years further into the future). However, it lags the rest of the country in terms of increases in tuition income. This is partly because, as noted earlier in Figure 3, international student numbers have lagged those in the rest of the country. However, as Figure 6 shows, it is also the case that average domestic fees have grown more slowly in Alberta than elsewhere in the country.
Figure 5: Indexed Change in Institutional Income from Governments and Tuition Fees, Alberta Scotia v. Other 9 Provinces, 2000-01 to 2019-2020 (2000-01 = 100)
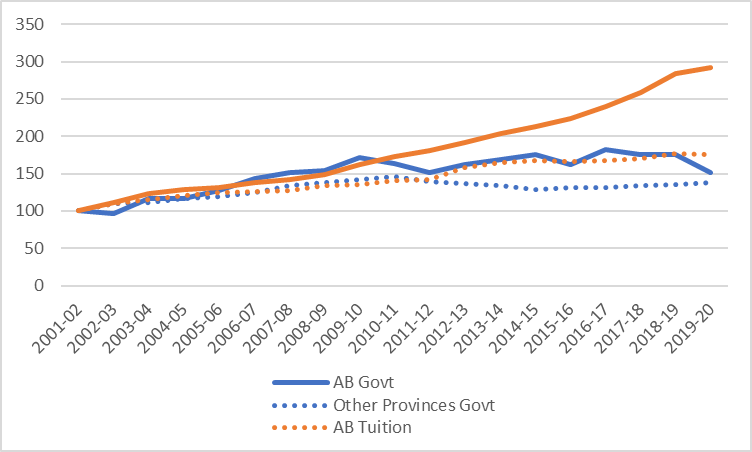
Figure 6: Tuition and Fees, Nova Scotia v. Alberta, in constant $2021.
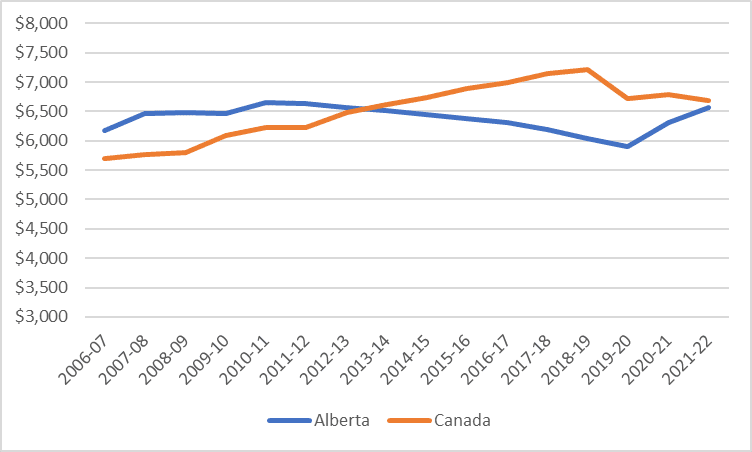
Figure 7 shows the average loan per recipient plus average grant per recipient over time in Alberta, from both federal and provincial sources (this is not quite the same thing as an average aid package, because not all loan recipients also receive grants). According to this information, combined federal-provincial aid packages in Alberta are the largest in the country, mainly because loans per student per year are over $13,000. This is only partially because grants are low; it is also because Alberta does not require any income-based parental contribution on its provincial loans, which naturally leads to higher borrowing.
Figure 7: Average Loan Plus Average Grant Disbursed, Alberta, 2011-12 to 2019-20, in constant $2019
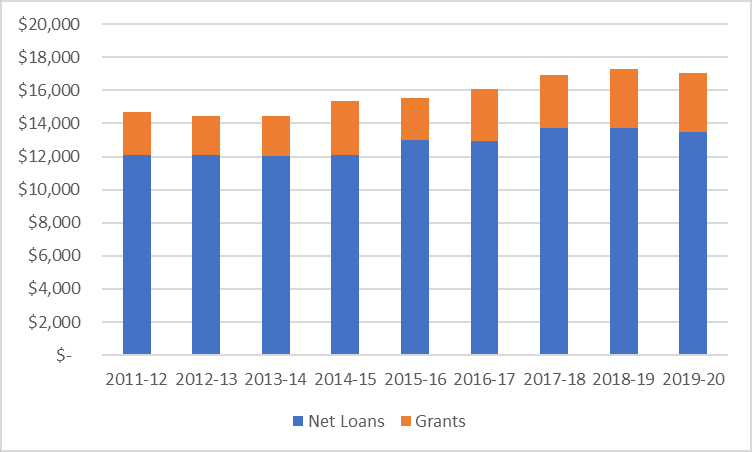
Figure 8 shows the change in distribution of provincial loans and grants (i.e. excluding Canada Student Loans) since 2011-12. What it shows is that both total loans and total non-repayable assistance (i.e. grants plus loan remission) provided by Alberta’s student financial aid program, in real dollars, rose much more quickly compared to those provided by other provincial programs. On the non-repayable side, this is mostly because 2011-12 was an anomalously low year for expenditures: if we could take a longer view we’d see that grants fell precipitously after the 2010 provincial budget. On the loans side, the faster loans growth was mostly a matter of a larger client base; both because more students were pouring into the system and because the no-parental-contribution rule increased eligibility.
Figure 8: Indexed Change in Total Real Provincial Loans and Grants Disbursed, Alberta vs. Other 9 Provinces, 2011-12 to 2019-20 (2011-12 = 100)
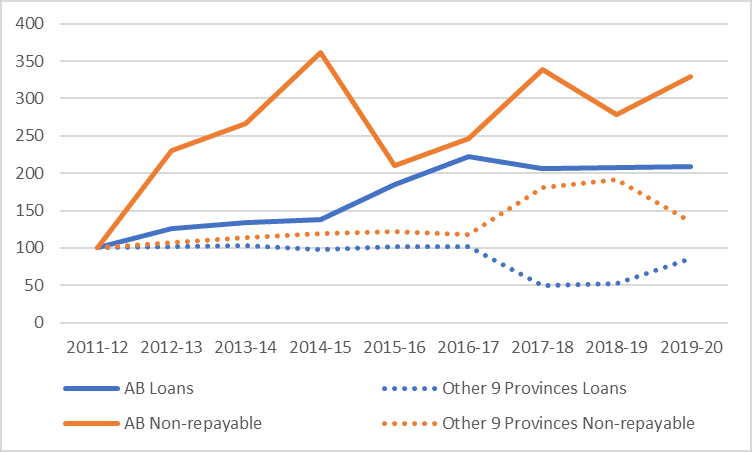
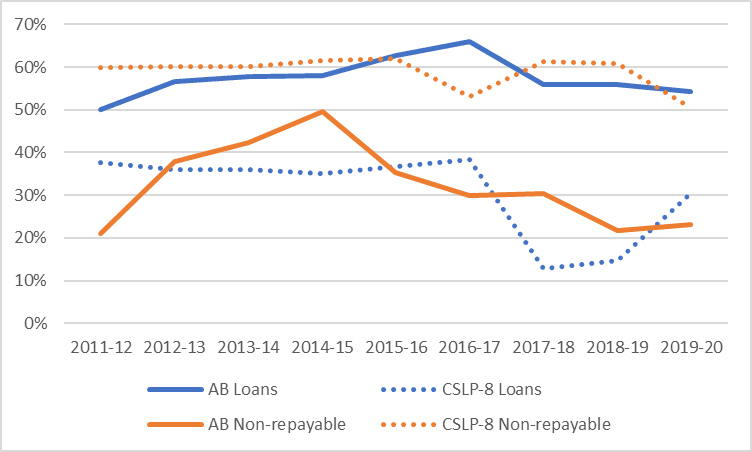
Figure 9 examines how much of the province’s student assistance comes from provincial as opposed to federal sources. For this exercise, I compare Alberta to just the other eight provinces which participate in the Canada Student Loans Program, because including Quebec would make this comparison a bit strange. Two very different patterns emerge. With respect to loans, Alberta issues about 55% of the province’s student loans; in the rest of the CSLP zone that figure is more like 30%. Conversely, Alberta issues only about 25% of all non-repayable assistance in the province, compared to an average of 50% in the rest of the CSLP-zone. In short, Alberta as a province is an outlier in its relatively high reliance on loans and aversion to grants, and this orientation was maintained without any noticeable change across governments of both the left and right.
Figure 9: Provincially-Funded Loans and Grants Disbursed as a Percentage of Total Loans and Grants Disbursed, Alberta vs. 8 other Canada Student Loans Program Provinces, 2011-12
Voila! Alberta in 1000 words and 9 graphs. Next up is British Columbia but before then I want to take a look at this year’s provincial budgets. More on that tomorrow.

