


As you may know, the HESA Towers team spends part of every summer compiling The State of Post-Secondary Education in Canada, which tracks national trends in higher education. But what we don’t often do is go a level below that, to look in depth at what’s happening in individual provinces and how these developments compare to what is going on in other parts of the country. So, for the next few weeks, we are presenting a statistical portrait of what is going on in at least a few of Canada’s ten provinces. Today we’ll start with Nova Scotia, where some of the HESA Towers team will be spending next week (drop by the HESA booth and say hi if you’re at the CICan meetings – we have chocolate!)
Anyways, let’s start with student numbers. As Figure 1 shows, Nova Scotia institutions have not increased in size significantly over the decade or so: universities have stayed consistently in a band around 38,000 FTEs and – until quite recently – the Nova Scotia Community College stood at around 10,000 FTEs.
Figure 1: Full-Time Equivalent Students, by Sector, Nova Scotia, 2000-01 to 2019-20
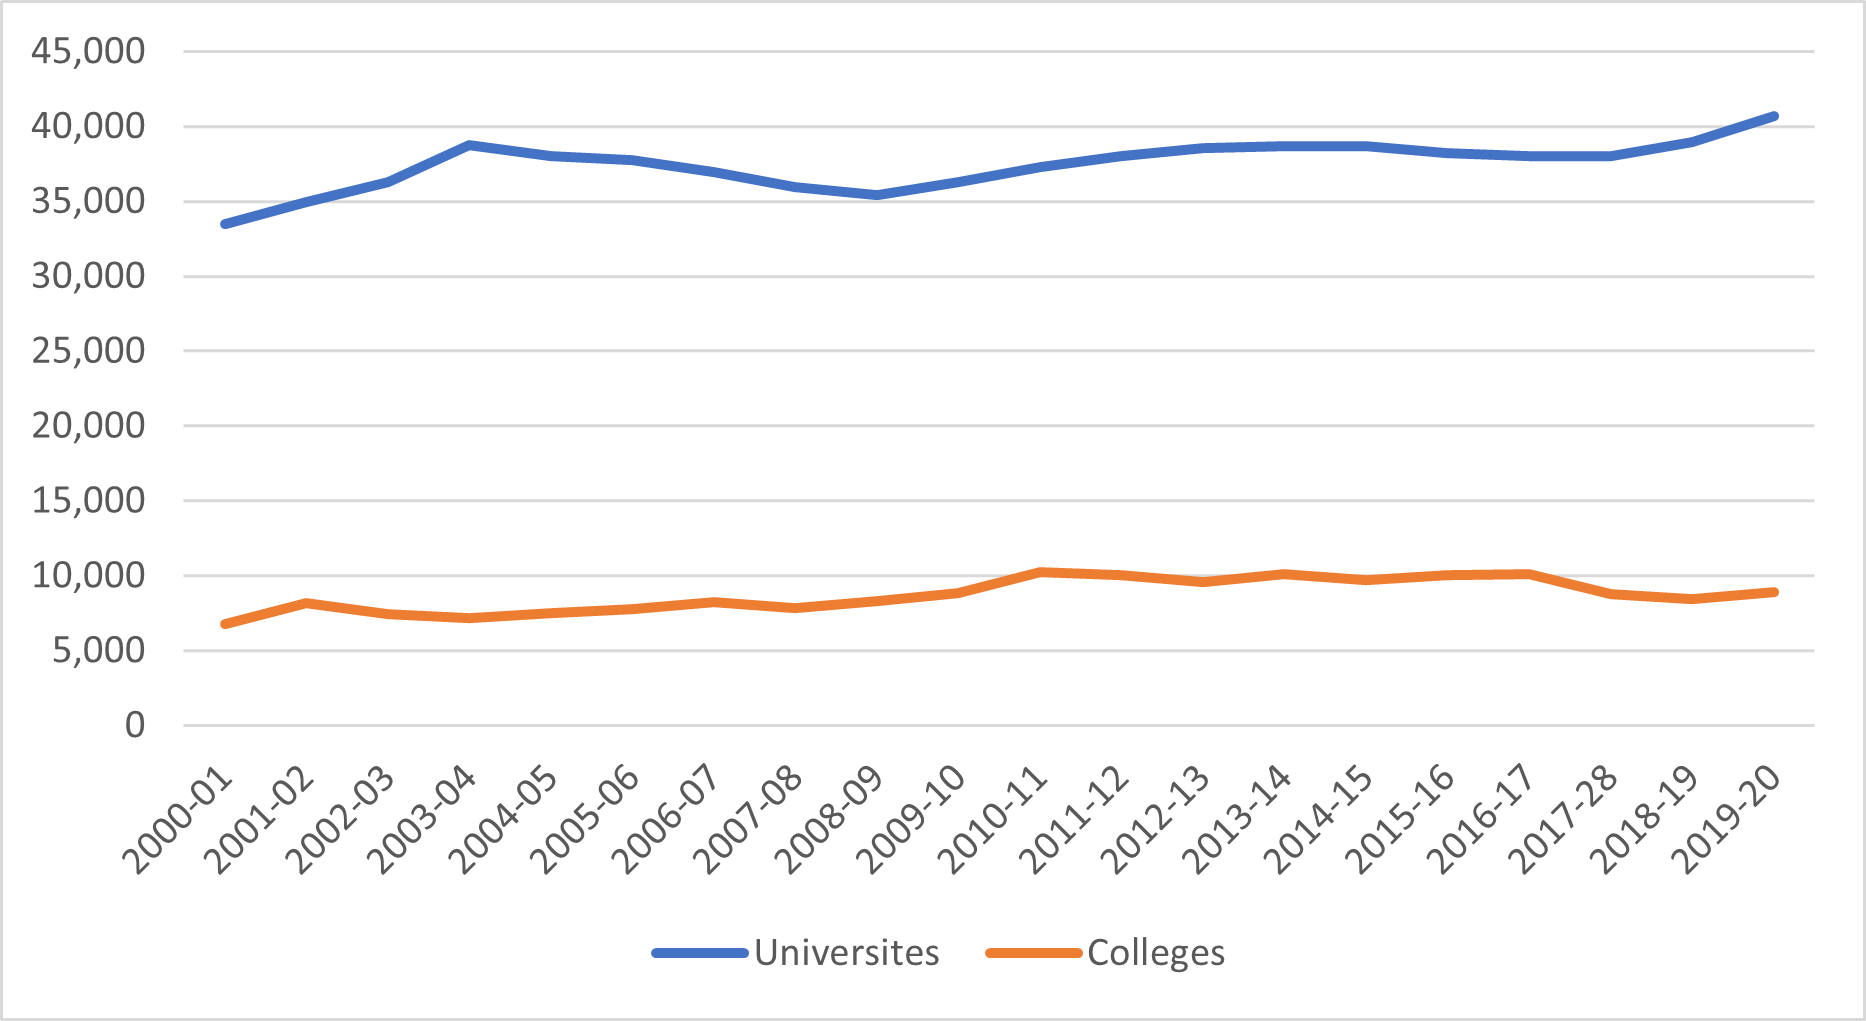
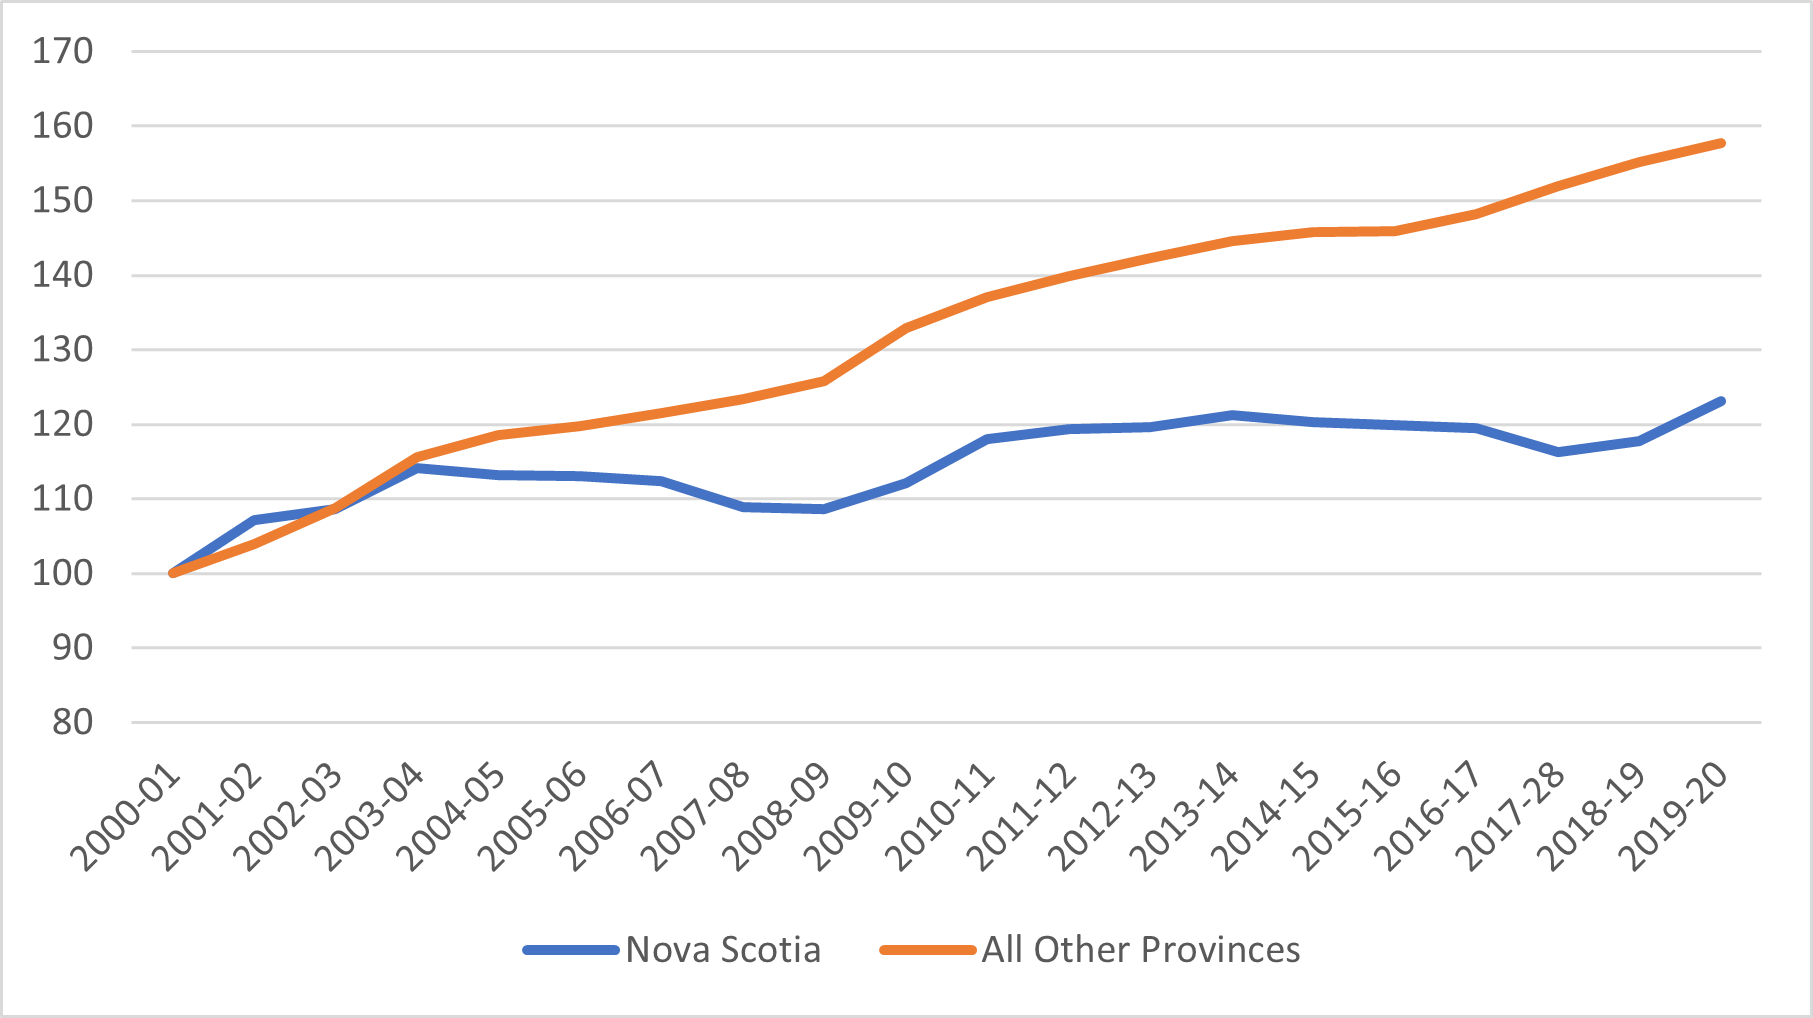
This is quite different from the national picture. Across the country as a whole, combined university and college FTEs have risen by about 60% since 2000, whereas in Nova Scotia the rise has been about 20%. The difference is almost entirely on the university side as the rise in college enrolments has been more or less equal to the national average.
Figure 2: Indexed Full-Time Equivalent Post-Secondary Students, Nova Scotia vs Other 9 Provinces, 2000-01 to 2019-20 (2000-01 = 100)
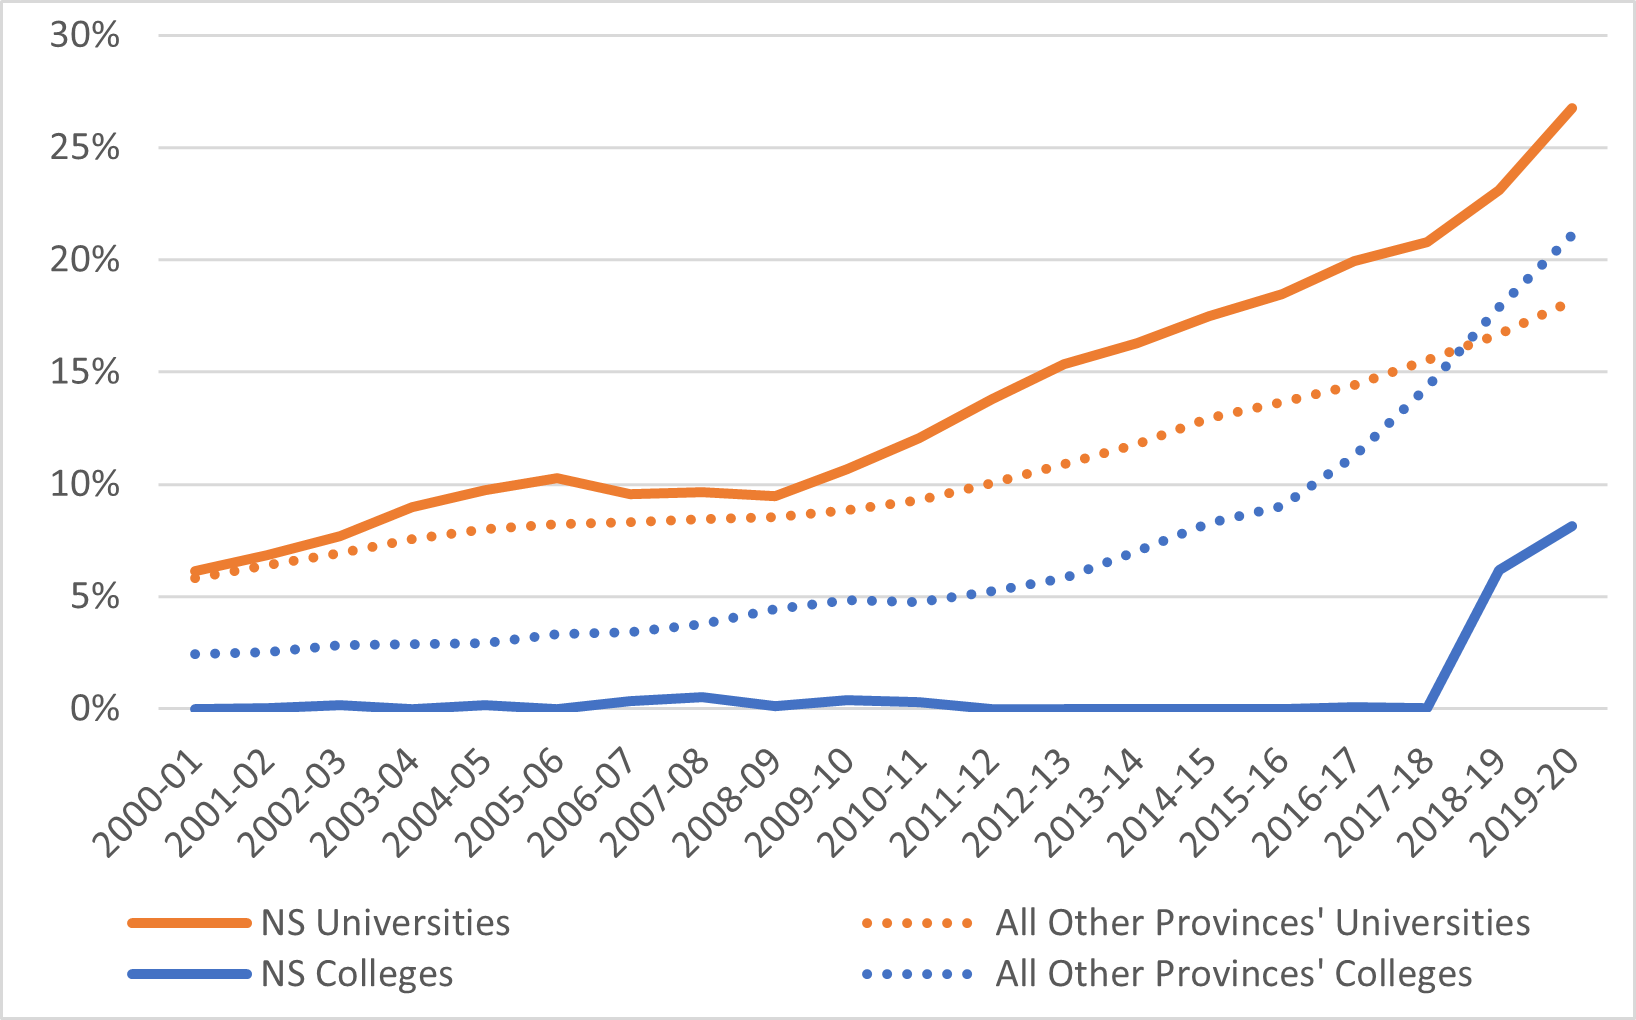
As in other provinces, the percentage of students from outside of Canada has grown substantially over the past few years. In total, 22% of students in the province are international students, and the proportion in universities is higher still (Nova Scotia colleges, however, lag the national average significantly in terms of international students). These proportions are higher in Nova Scotia than in the rest of the country, but the growth trends in Nova Scotia are roughly parallel to those in other provinces.
Figure 3: Proportion of Students From Outside Canada, by Sector, Nova Scotia vs other 9 provinces, 2000-01 to 2019-20 (2000-01 = 100)
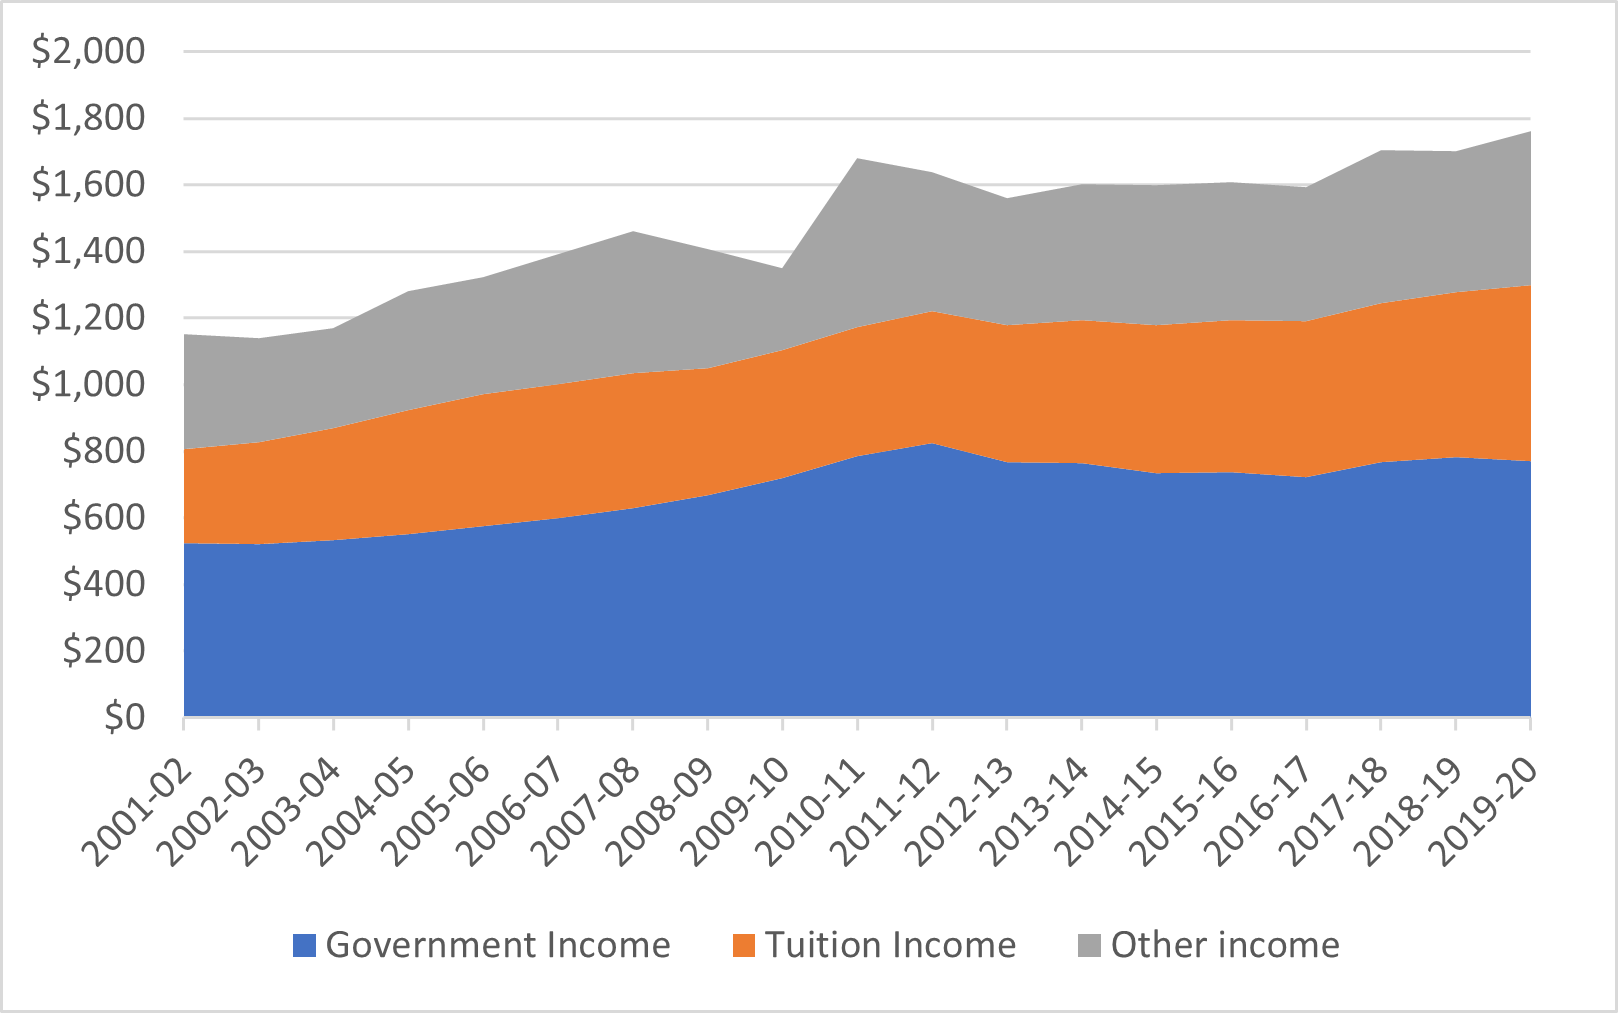
In terms of funding, current aggregate revenues for Nova Scotia universities and colleges are about $1.8 billion per year. To the extent that there has been an increase in revenues in recent years, it has come almost exclusively from self-generated revenue (that is, tuition fees and “other” revenue); government revenue has been stagnant in real terms since about 2009.
Figure 4: Total PSE Institutional Revenue by Source, Nova Scotia, 2000-01 to 2019-20, in millions of constant $2019
As Figure 5 shows, this pattern of stagnant government funding since 2010 is the national norm. Where it lags the rest of the country is in the growth of fee income. This might seem like something of a puzzle since, as shown below in Figure 6, average domestic fees have been growing more quickly in Nova Scotia than in the rest of the country since about 2015; indeed, since the Ford government cut tuition in Ontario by 10% in 2019, Nova Scotia has had the highest average tuition fees in the country (a position which it held for most of the 1980s to 2000s). However, the puzzle is solved by the fact that international student fees that have increased more quickly elsewhere than in Nova Scotia.
Figure 5: Indexed Change in Institutional Income from Governments and Tuition Fees, Nova Scotia v. Other 9 Provinces, 2000-01 to 2019-2020 (2000-01 = 100)
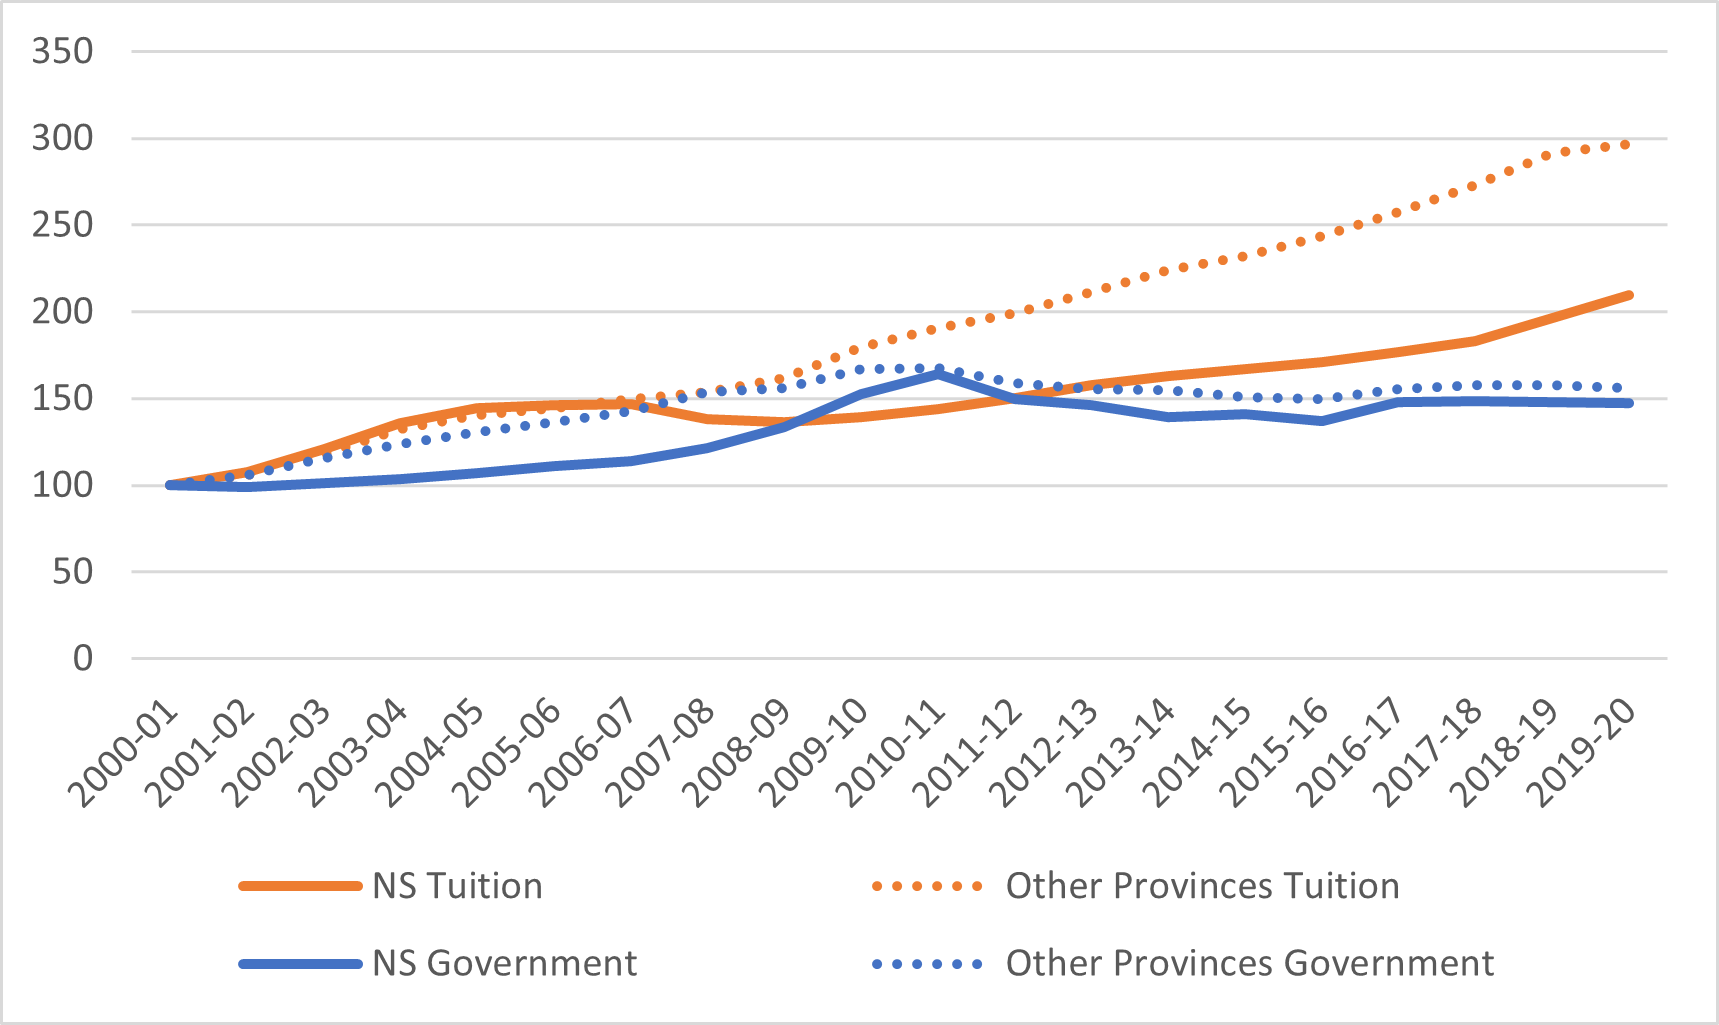
Figure 6: Tuition and Fees, Nova Scotia v. Canada, in constant $2019.
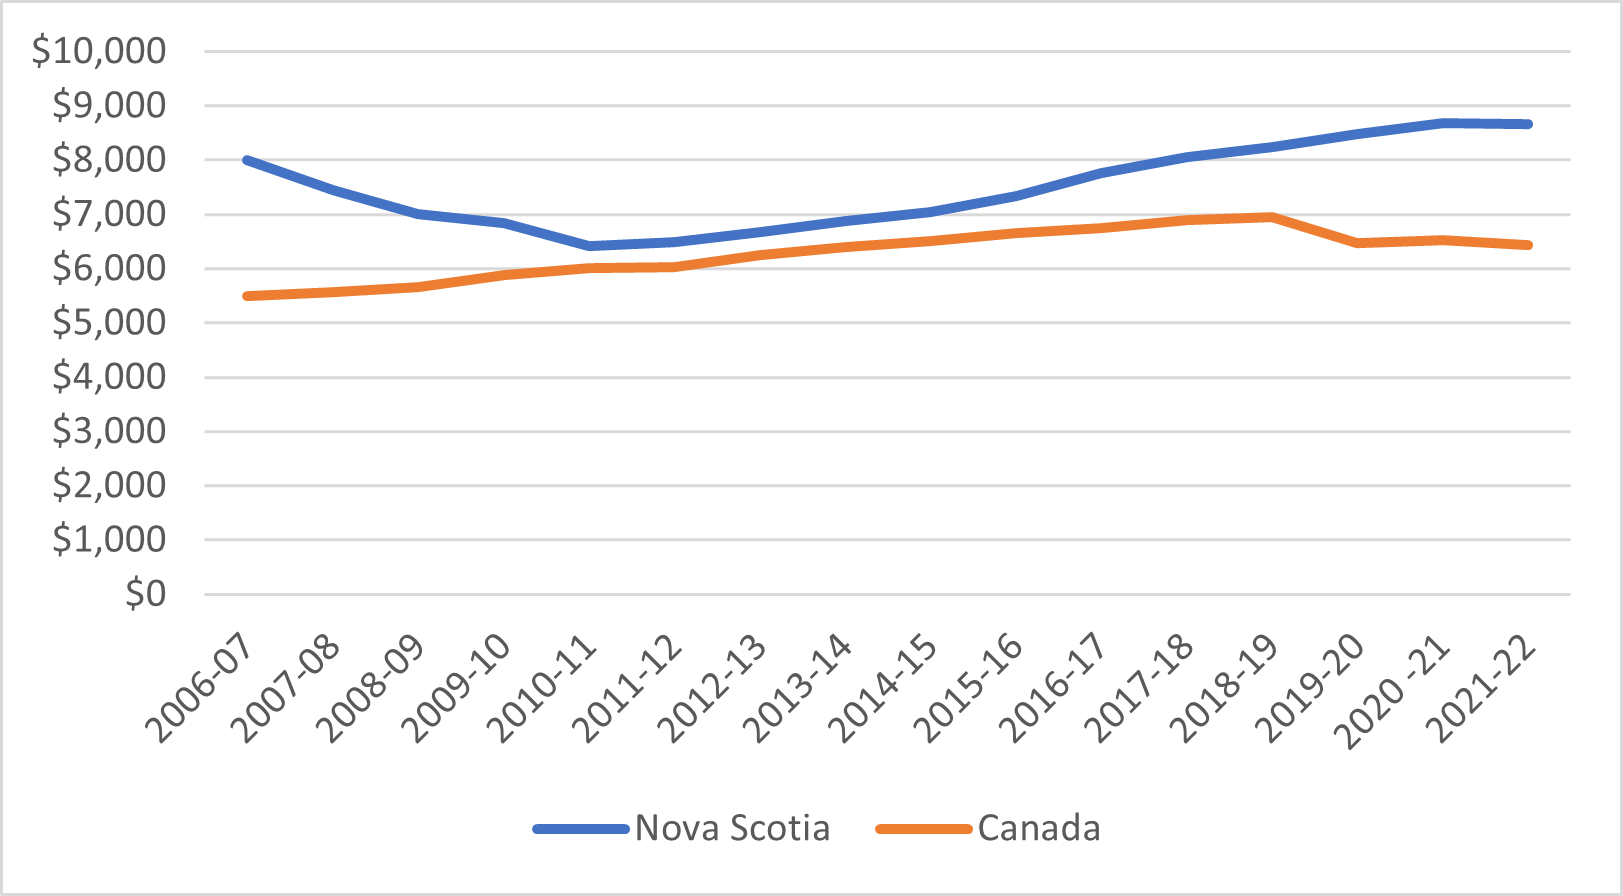
Figure 7 shows the average loan per recipient plus average grant per recipient over time in Nova Scotia, from both federal and provincial sources (this is not quite the same thing as an average aid package because not all loan recipients are also grant recipients). According to this information, combined federal-provincial aid packages have remained more or less constant across the past decade in real terms at just under $10,000 per year in loans, and between $2,000 and $2,500 in grants.
Figure 7: Average Loan Plus Average Grant Disbursed, Nova Scotia, 2011-12 to 2019-20, in constant $2019
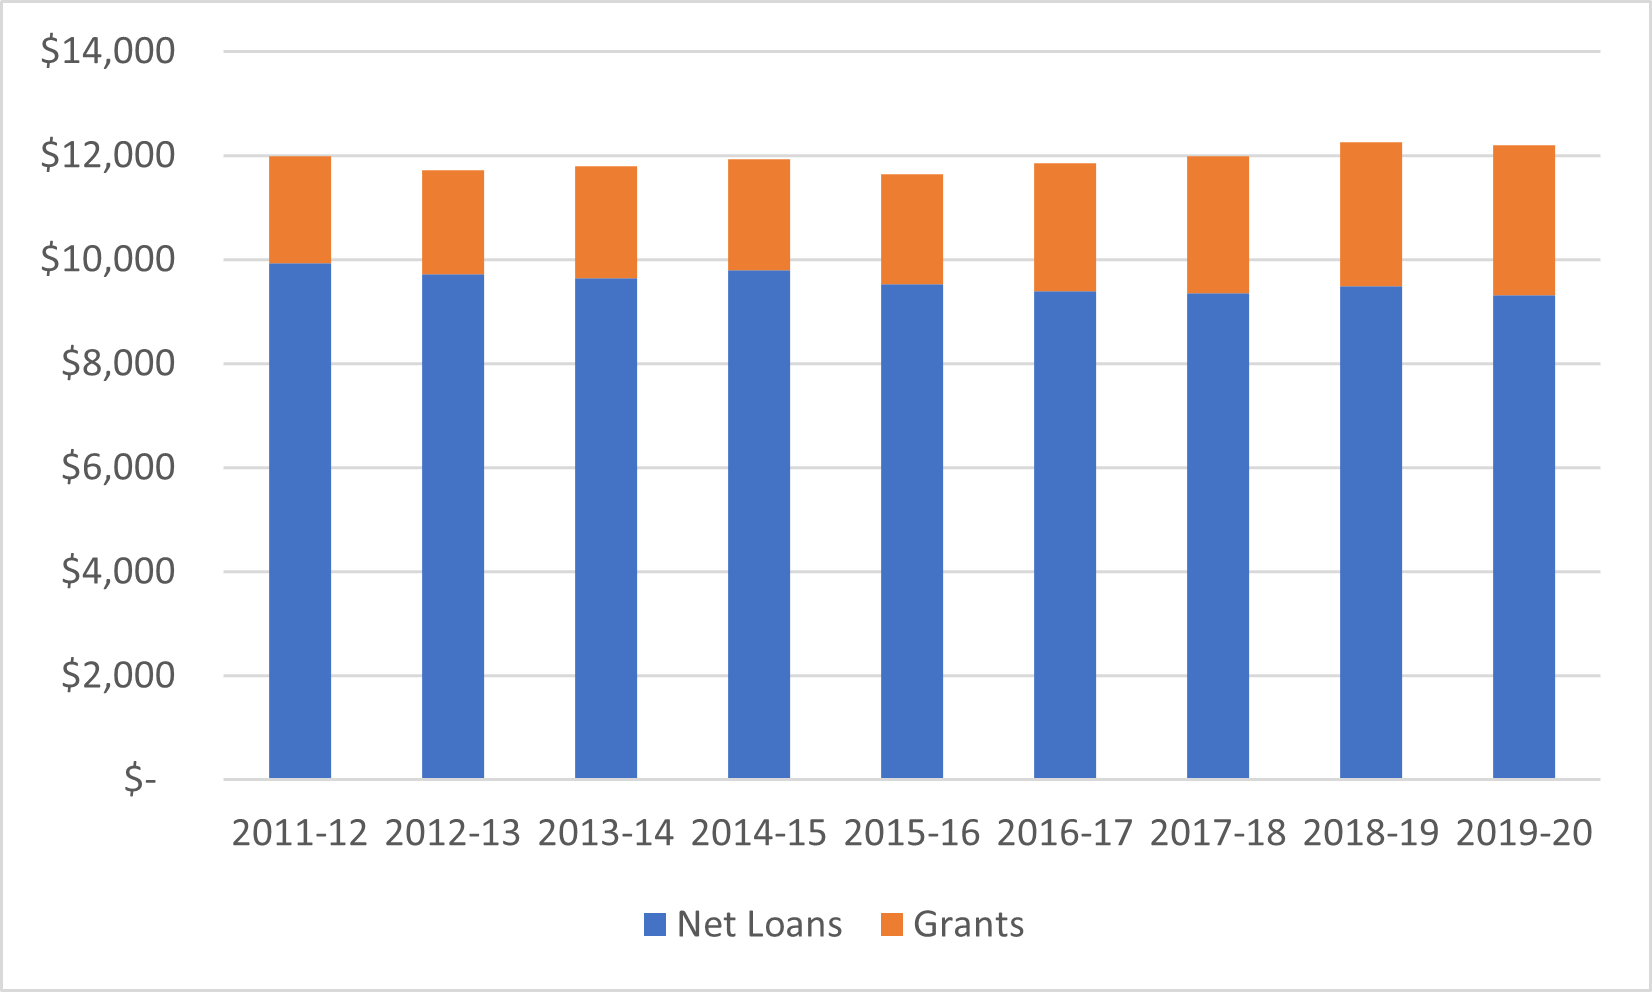
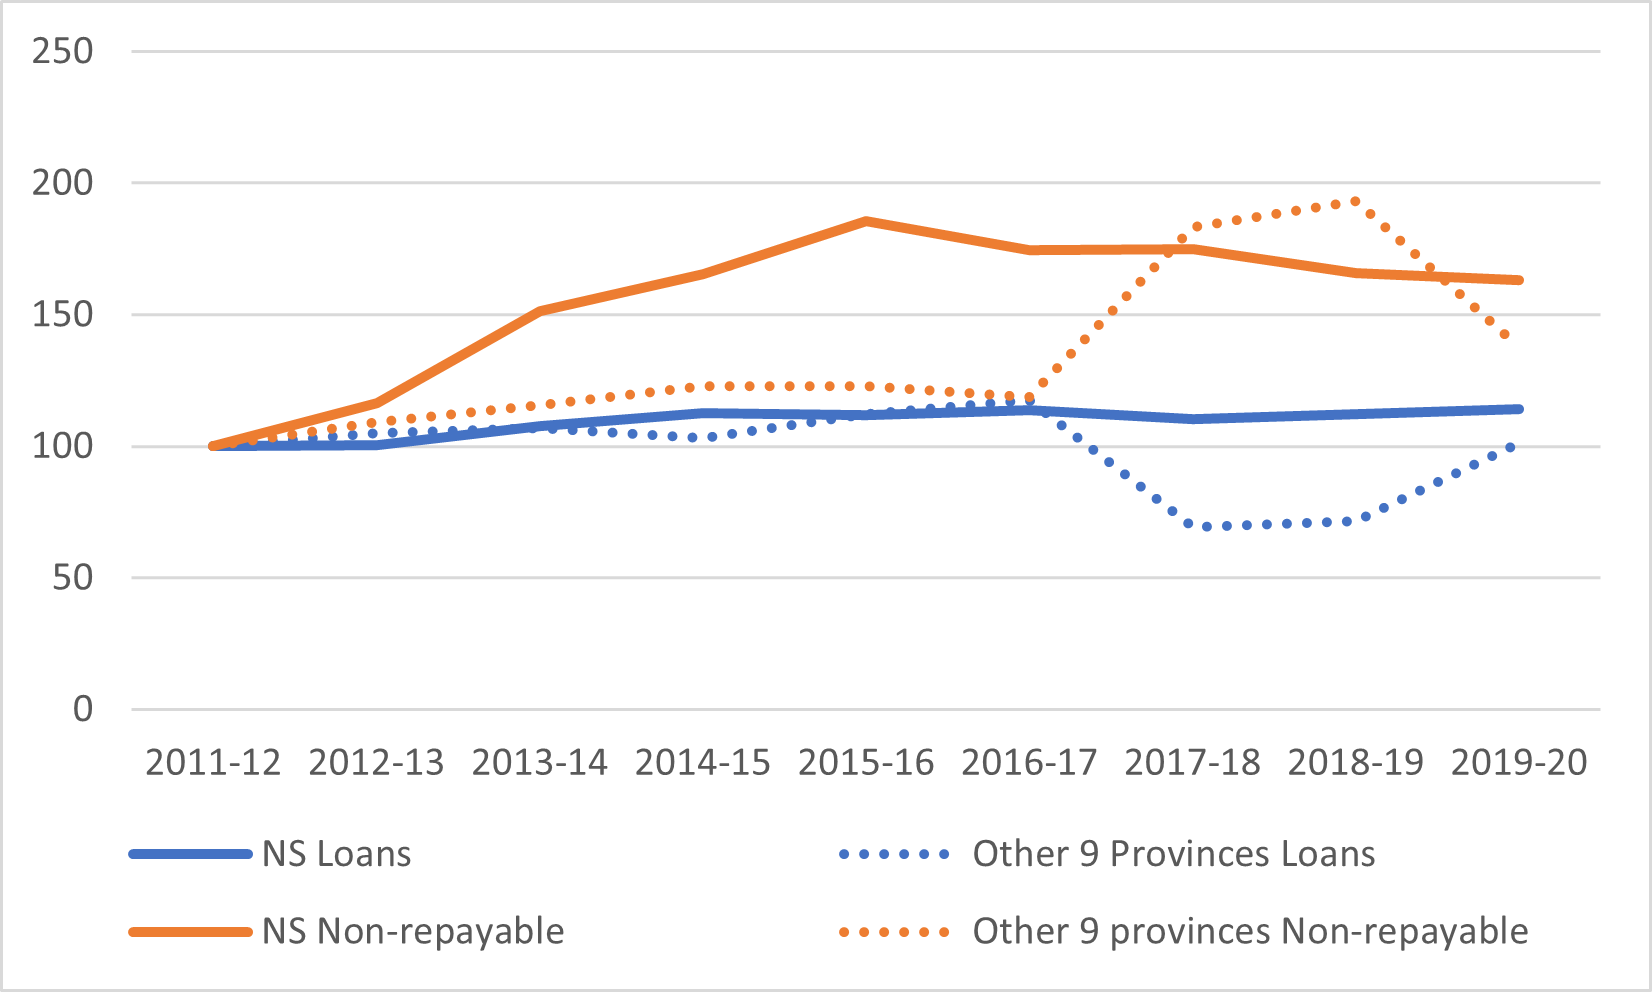
Figure 8 shows the change in distribution of provincial loans and grants (i.e. excluding Canada Student Loans) since 2011-12. What it shows is that total loans and total grants provided by Nova Scotia’s student financial aid program rose slightly faster compared to those provided by other provincial programs (the big up/down shifts in the rest of the country are due to the big shift to “targeted free tuition” under the Wynne government in Ontario in 2016 and the big move away from same by the Ford government in 2019.
Figure 8: Indexed Change in Total Provincial Loans and Grants Disbursed, Nova Scotia vs. Other 9 Provinces, 2011-12 to 2019-20 (2011-12 = 100)
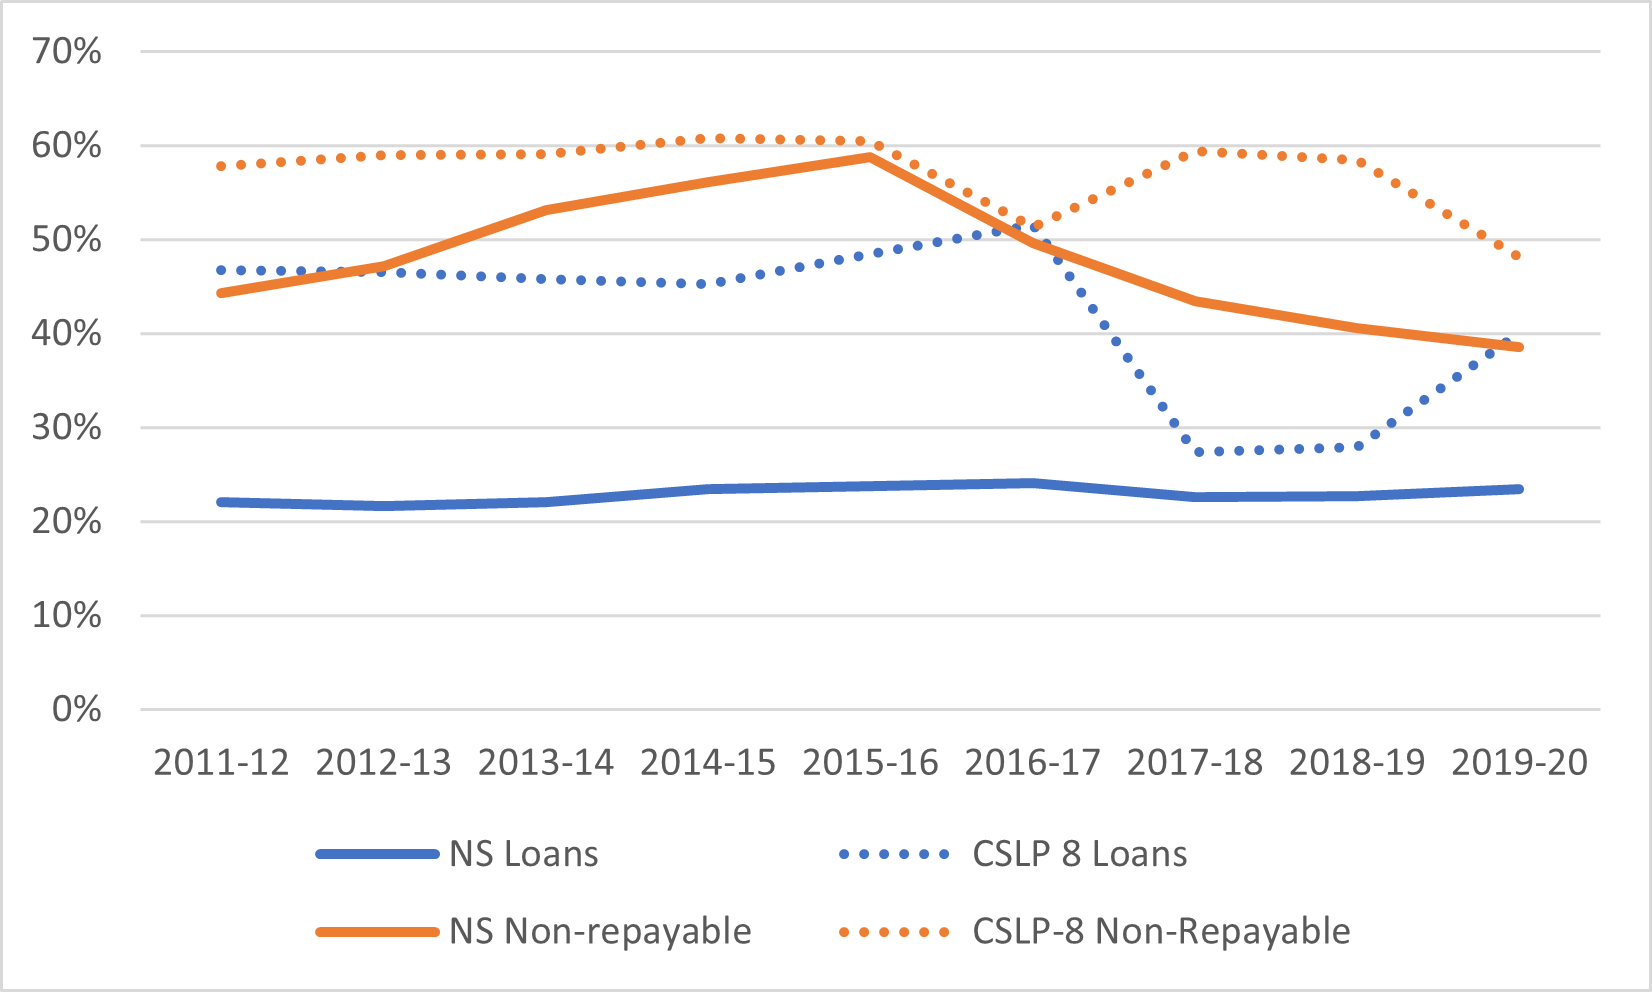
Finally, we can examine how much of the province’s student assistance comes from provincial as opposed to federal sources. For this exercise, I will compare Nova Scotia to just the other eight provinces which participate in the Canada Student Loans Program, because including Quebec would make this comparison a little bit strange. For some fairly obscure reasons, Nova Scotia has never followed the same program rules on Canada Student Loans as the other provinces, and has been allowed to use federal funds in a way that minimize its own loan exposure – this is why the provincial government only issues about 20% of the loans issued to Nova Scotia students, compared to 30-50% in other provinces. As for non-repayable aid (that is, grants and remissions combined), Nova Scotia is again more reliant on federal sources to help its students than other provinces. Nova Scotia is responsible only for about 40% of total assistance, compared to 50% in other provinces.
Figure 9: Provincially-Funded Loans and Grants Disbursed as a Percentage of Total Loans and Grants Disbursed, Nova Scotia vs. 8 other Canada Student Loans Program Provinces, 2011-12
There you go: Nova Scotia higher education in 1,000 words and nine graphs.
Enjoy this piece? Have suggestions about what else/not to include? Want your province to be next? Drop us a line at info@higheredstrategy.com.

