


Morning everyone. Today’s edition of the Nutshell series features one of the more anomalous provinces in Canada (from a higher education perspective, at least), the one whose beaches Le Monde once referred to as “Canada’s Riviera”: New Brunswick!
New Brunswick’s anomalous status is mostly centered around the issue of enrolment: it is the only province in Confederation that has seen effectively no growth over the past two decades. This is not to say that there have been no changes – university enrolment is down a bit and college enrolment is up a bit – but essentially numbers are flat.
Figure 1: Full-time Equivalent Students, by Sector, 2000-01 to 2019-20

How much of an outlier does that make New Brunswick? Well, check out Figure 2. In the early years of the century, New Brunswick enrolments were increasing at a pace similar to the rest of the country…and then suddenly after 2005, they weren’t. Across the rest of the country, FTE numbers kept rising at 2-3% per year – almost 60% in total between 2000-01 and 2019-20, while in New Brunswick they shrank for a number of years before finally coming to rest at 5% above 2000-01 levels.
Figure 2: Indexed Full-Time Equivalent Post-Secondary Students, New Brunswick vs Other 9 Provinces, 2000-01 to 2019-20 (2000-01 = 100)

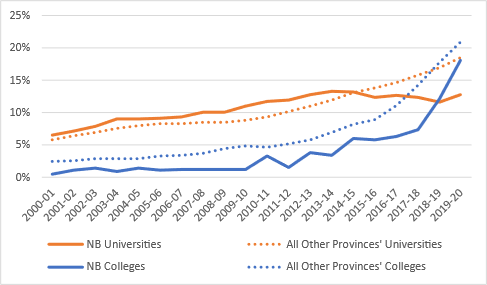
New Brunswick used to track the national average as far as international students were concerned – its universities just a little bit ahead and the colleges a but behind. But that all seems to have changed in recent years, as international student numbers on the university side actually declined 20% between 2012-13 and 2017-18 before slightly rebounding. Colleges, on the other hand, have done somewhat better, and – again in contrast to elsewhere in the country – the provincial francophone college is doing as well or better than the anglophone side in attracting international students.
Figure 3: Proportion of Students from Outside Canada, by Sector, New Brunswick vs other 9 provinces, 2000-01 to 2019-20 (2000-01 = 100)
With respect to institutional funding, the picture in New Brunswick differs from most of the country not so much in the stagnation of government funding but in the stagnation of student funding. Elsewhere in the country, student income growth has been driven by some combination of increasing numbers of domestic students, increasing international students and rapidly rising international student fees. In New Brunswick, effectively none of these three drivers have been functioning over the past decade.
Figure 4: Total PSE Institutional Revenue by Source, New Brunswick, 2000-01 to 2019-20, in millions of constant $2019
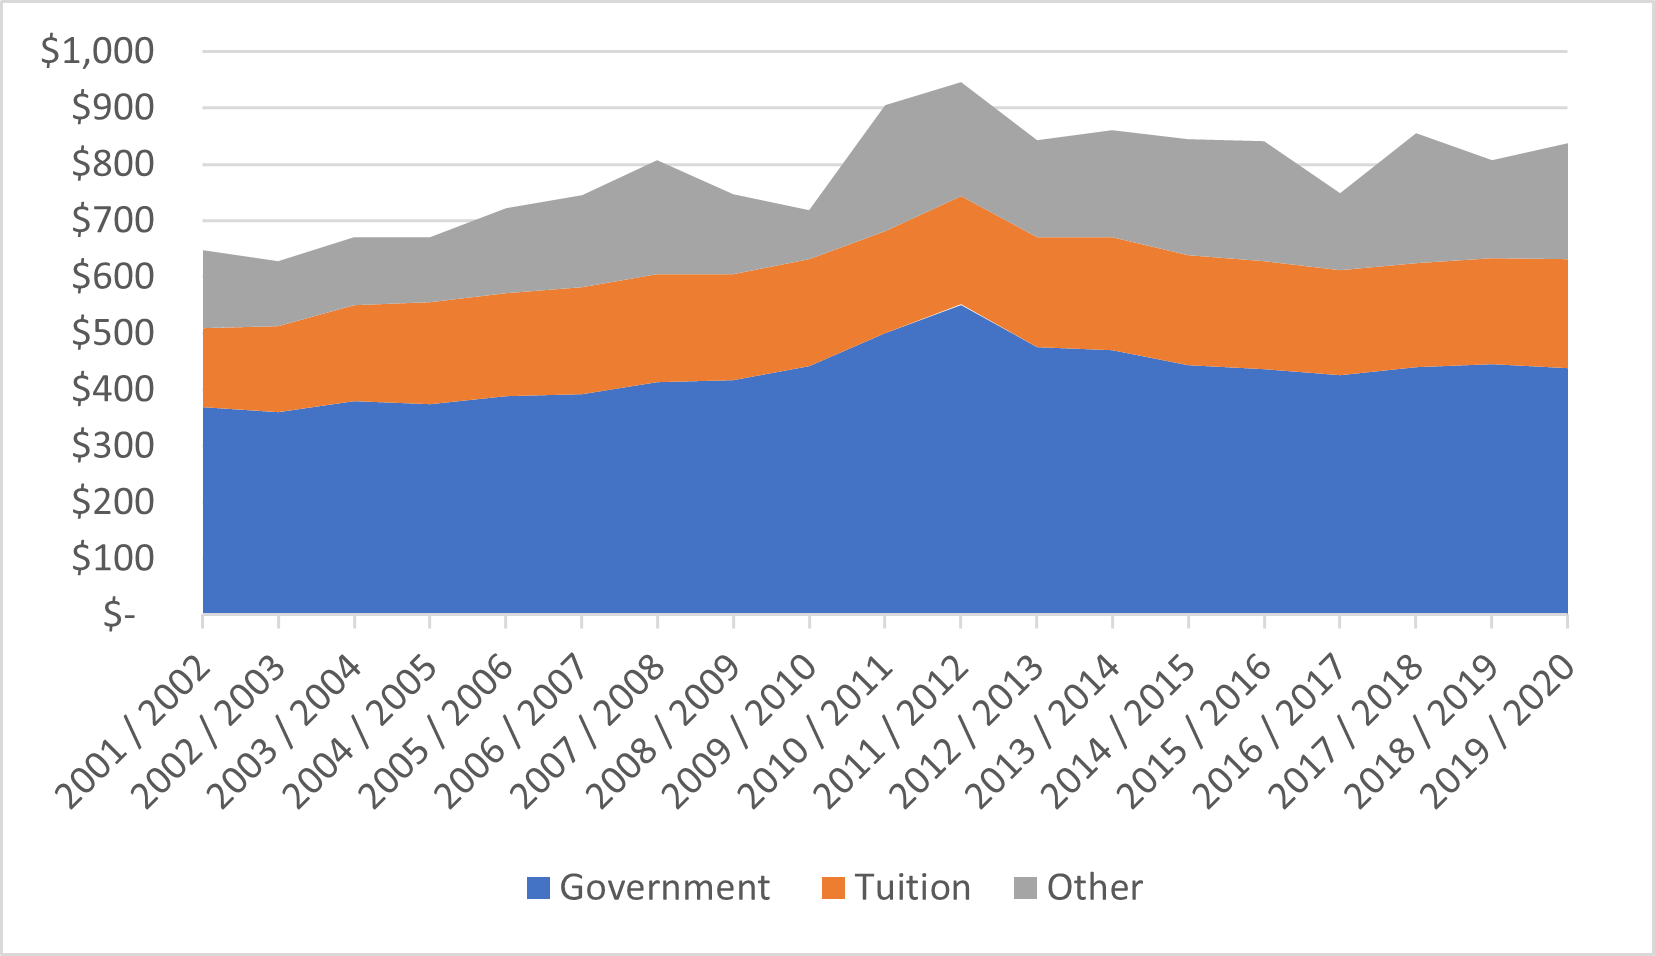
Figure 5 shows this same point somewhat more starkly. In New Brunswick, government transfers to institutions have lagged those in other provinces consistently over the past 20 years (though if we normalized this in per-student terms, the gap would be much less obvious). However, tuition income has lagged other provinces by a staggering amount. This is not because domestic tuition rates have changed very much – as Figure 6 shows, they stand pretty much where they did 20 years ago relative to the national average – but rather that the provinces simply has not taken part in the international student boom of the last couple of decades.
Figure 5: Indexed Change in Institutional Income from Governments and Tuition Fees, New Brunswick v. Other 9 Provinces, 2000-01 to 2019-2020 (2000-01 = 100)

Figure 6: Tuition fees, New Brunswick v. Canada, 2006-07 to 2021-22 (in constant $2021)
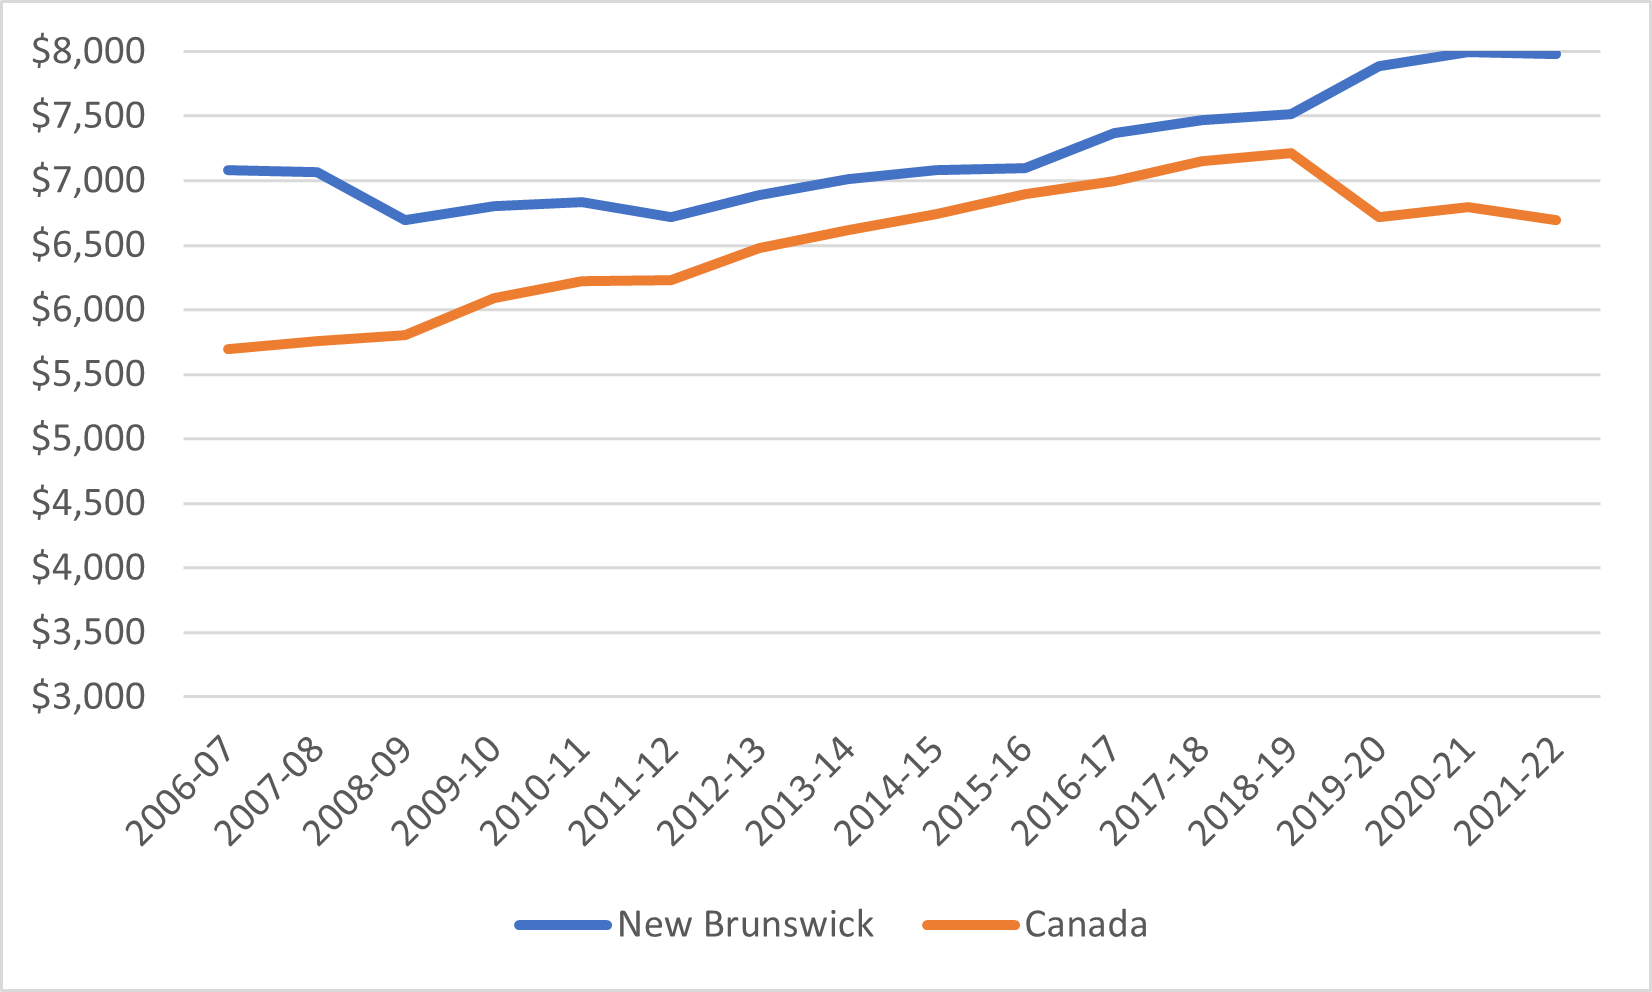
Figure 7 shows the average loan per recipient plus average grant per recipient over time in New Brunswick, from both provincial and federal sources (this is not quite the same as an average aid package because not all loan recipients also receive grants). New Brunswick students have not seen much change in their aid packages over the past decade: overall loan amounts have stayed constant at just under $10,000, but grants have increased slightly aid from about $2,000 to $3,000 annually.
Figure 7: Average Loan Plus Average Grant Disbursed, New Brunswick, 2011-12 to 2019-20, in constant $2019

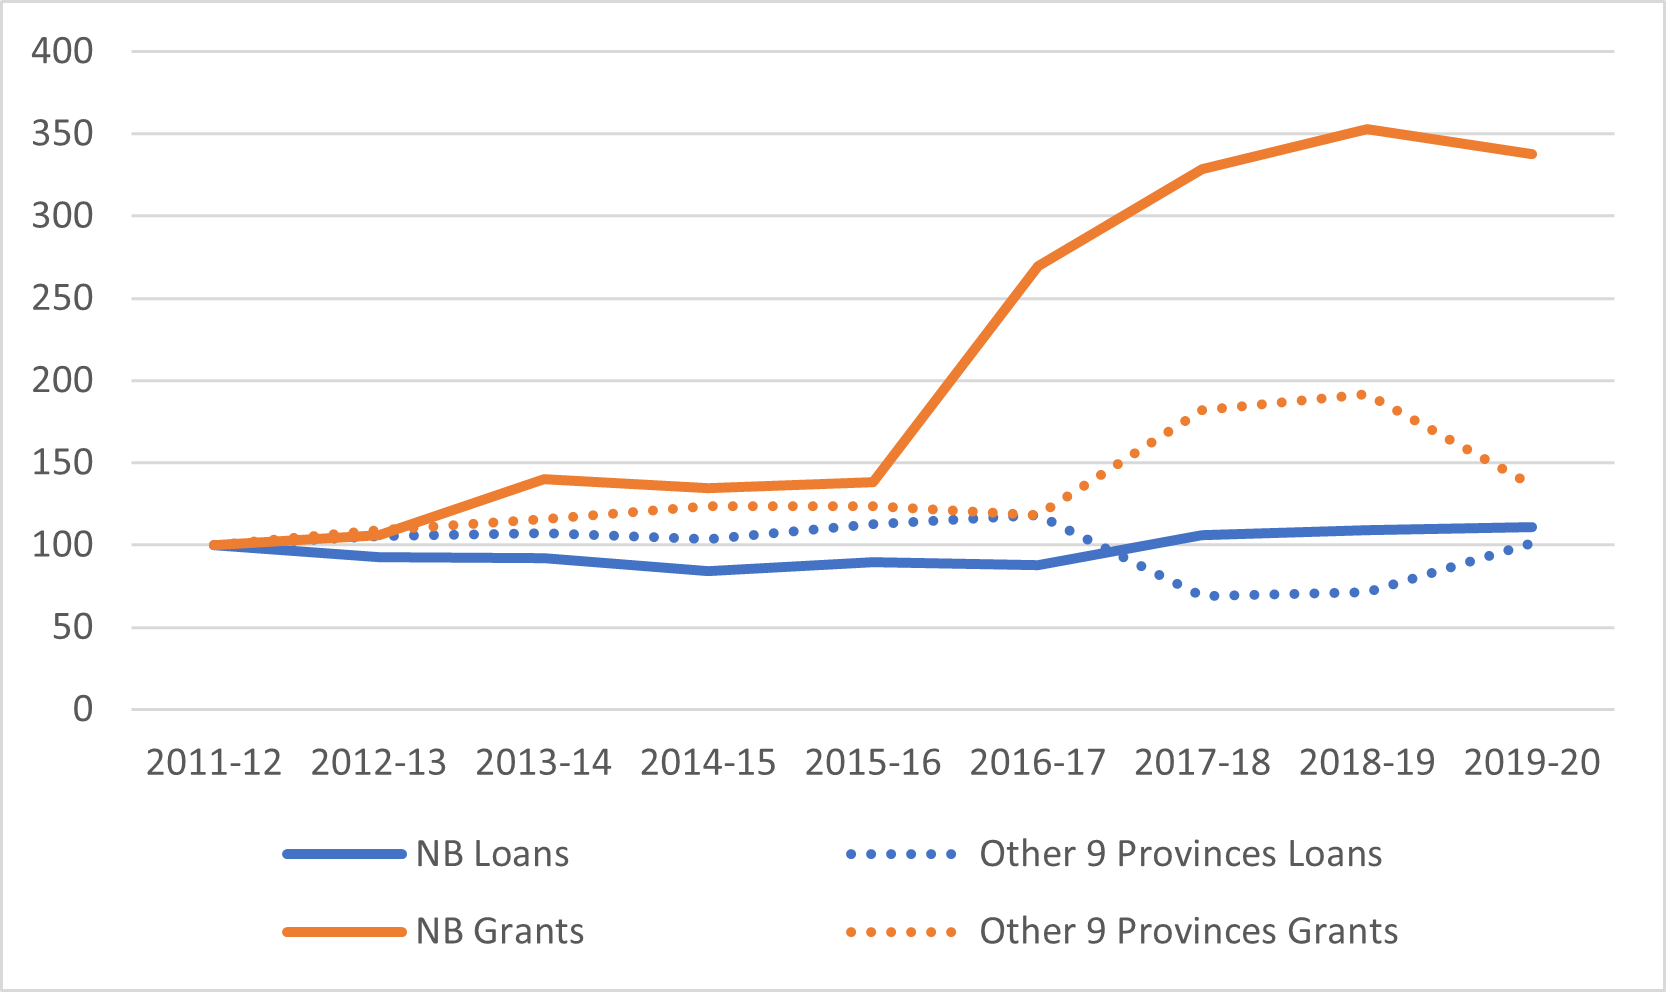
While total loan disbursements have more or less tracked those in the rest of the country, the situation with grants is very different. For many years, the province had a very generous – perhaps even recklessly generous – system of tax credits designed to refund tuition fees to graduates who stayed in the province. In 2014, a Liberal government eliminated this credit and later re-invested the money into a program of targeted free tuition (that is, a set of grants that brought net tuition to zero for low-income students) – which accounts for the major jump in grant amounts in 2015, observable in Figure 7. Then in 2018, a new government came to town with some very strange ideas about student aid, which resulted in some deeply odd changes to the student aid system and which explain the subsequent decline in grants.
Figure 8: Indexed Change in Total Real Provincial Loans and Grants Disbursed, New Brunswick vs. Other 9 Provinces, 2011-12 to 2019-20 (2011-12 = 100)
Finally, Figure 9 looks at how much of the province’s student assistance comes from provincial as opposed to federal sources, excluding Quebec. What we see in this figure is that where grants are concerned, New Brunswick contributes roughly the same proportion as other provinces (that is, around 50%); however, it issues a considerably larger proportion of total loans in the provinces than is the case elsewhere.
Figure 9: Provincially-Funded Loans and Grants Disbursed as a Percentage of Total Loans and Grants Disbursed, New Brunswick vs. 8 other Canada Student Loans Program Provinces, 2011-12

So that’s five provinces down. Seems I won’t quite get to all ten before I break for the summer, (apologies in advance, Saskatchewan and PEI! We see in you in September!). Next up, early next week is Ontario, just in time for the election.


One Response
I think this excellent analysis would be enhanced if you mentioned the population and demographic challenges in New Brunswick (the oldest or second oldest province in Canada for the last few years).
A couple of years ago I looked at NB population demographics for an MBA stats project. Folks might find the tables interesting (ignore all the R commentary stuff!)
https://rpubs.com/dkilfoil/639184