


On Thursday, the OECD released its annual Education at a Glance report. I always do a blog post about these, even though, let’s face it, very little changes annually. But I have zero desire to talk about this godforsaken election anymore, so this seems like a welcome opportunity to change the subject a bit.
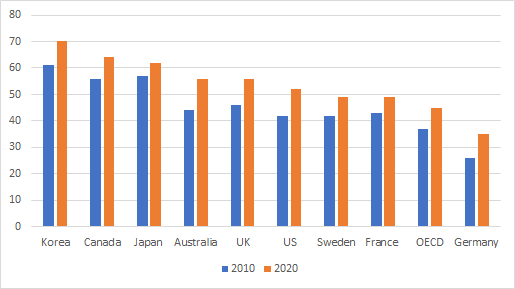
Let’s start with Figure 1, tertiary attainment rates, where Canada always performs well. This shows Canada as having one of the highest tertiary attainment rates in the developed world – basically 20 percentage points higher than the OECD average. This works as long as you consider all Canadian college education as “tertiary” education, which, strictly speaking, it isn’t. I will spend some time next week explaining how the Canadian college system is vastly distorted in international context, but for now just recognize that a) OECD thinks we have great completion rates but b) our numbers are inflated by about ten or fifteen percentage points, thanks to the weird-ass way we report these numbers.
Figure 1: Attainment Rates Among 25-34 Year-Olds, Select OECD Countries, 2010 and 2020.
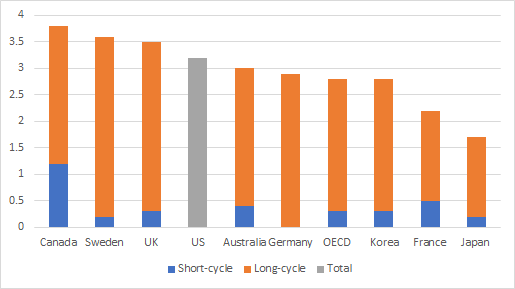
Then there is funding. Figure 2 shows total public funding – that is, including things like student assistance and funding to ancillary enterprises like hospitals – as a percentage of GDP, and divvied up according to the eventual destination of the spending: “long-cycle” tertiary (which roughly means universities and any other institutions which mainly give out bachelor’s degrees, like fachhochschule in Germany) and short-cycle tertiary (community colleges, basically). Well, it lets you do this for every country except the United States, which cannot be arsed to separate funding for 2- and 4-year institutions because reasons. By this measure, Canada seems to be tops in the OECD, in no small part because of the amount it spends on short-cycle institutions (i.e. colleges)
Figure 2: Total Public Spending on Higher Education as a Percentage of GDP, Select OECD countries 2018
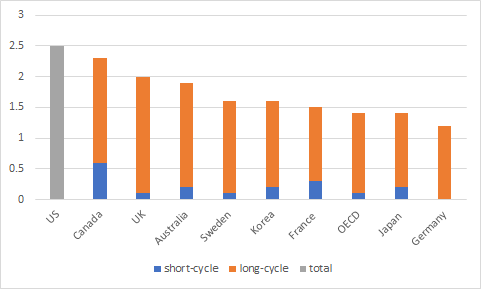
The OECD data also permits a similar comparison for institutional funding (including both public and private funding), which I present below in Figure 3. And this shows a somewhat different picture. For one thing, the US passes Canada, which honestly doesn’t make a whole lot of sense unless the two countries are capturing and reporting data quite differently. But check out Germany: in Figure 2 public spending is close to 3% of GDP, but in Figure 3 it is barely 1.3%. What the heck is going on here? Best guess: it’s partially funding to university hospitals, which is a really big deal in German universities, and it is partly public research funds that end up indirectly in university coffers through various public foundations (Germans call this “dritmitte” or “third-party funds”). In Canada, of course, these third-party funds would be counted directly as government funding – which shows the need to take care in making international comparisons.
Figure 3: Total (public + private) Institutional Funding as a Percentage of GDP, by Institutional Type, Select OECD Countries, 2018
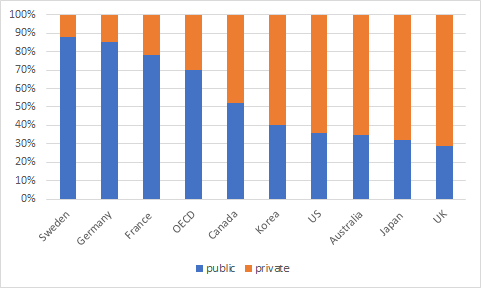
But public funding isn’t the whole story: in many countries, private funding is the leading source of income. Figure 4 shows the percentage of institutional income which comes from public and private sources. Not only does Canada spend a huge amount of public money on higher education, it also invites in a boatload of private funding. Generally, the countries with the highest total spending on institutions (see Figure 3) are the ones that have the highest level of private funding (Figure 4).
Figure 4: Public/private Funding Split in Tertiary Education Institutional Funding, Select OECD Countries, 2018
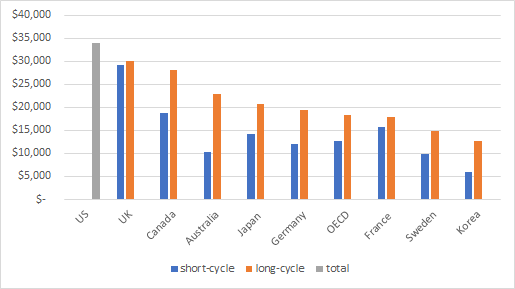
A final financial comparison considers institutional funding per student, a comparison which, holding aggregate spending constant, tends to reward countries with lower rates of participation (but hey, some people really like this comparison). Anglophone countries tend to do very well on this measure, in part because they can rely on much more substantial international student fees to support overall spending. Note that the UK reports very high per-student spending on students in short-cycle spending; however, a quick look at Figures 2 and 3 remind us that this sector is barely a factor in the UK, and that among countries with significant short-cycle programs, Canada’s funding levels are significantly above the norm.
Figure 5: Per-student Funding by Institutional Type, in USD at PPP, Select OECD Countries, 2018
That’s it. As usual, the OECD data shows Canada as a country with high rates of attainment and extremely high levels of funding. It has been showing this for roughly two decades now. Perhaps all the folks who claim that we have grievous access or funding problems could pay a little attention.

