


Back in early July, the Canadian Undergraduate Survey Consortium (CUSC) released its triennial survey of graduating students. As always, one of the most interesting things in there is the data on student debt, because it is one of the few good, up-to-date national snapshots that we have of the issue.
There are some limitations to the snapshot. It doesn’t report out on a provincial basis, only a national one. It doesn’t really include Quebec. The sample in the survey is inconsistent because consortium membership changes over time (18 years ago, there were a lot more “big universities” in the sample). But consider the alternatives. Provinces have actual administrative data but choose not to publish it. Statscan only surveys every fifth cohort, and then waits three years to interview people and then another year to report, so any data on debt is a minimum of four years out of date by the time its published. In comparison, CUSC data looks pretty good.
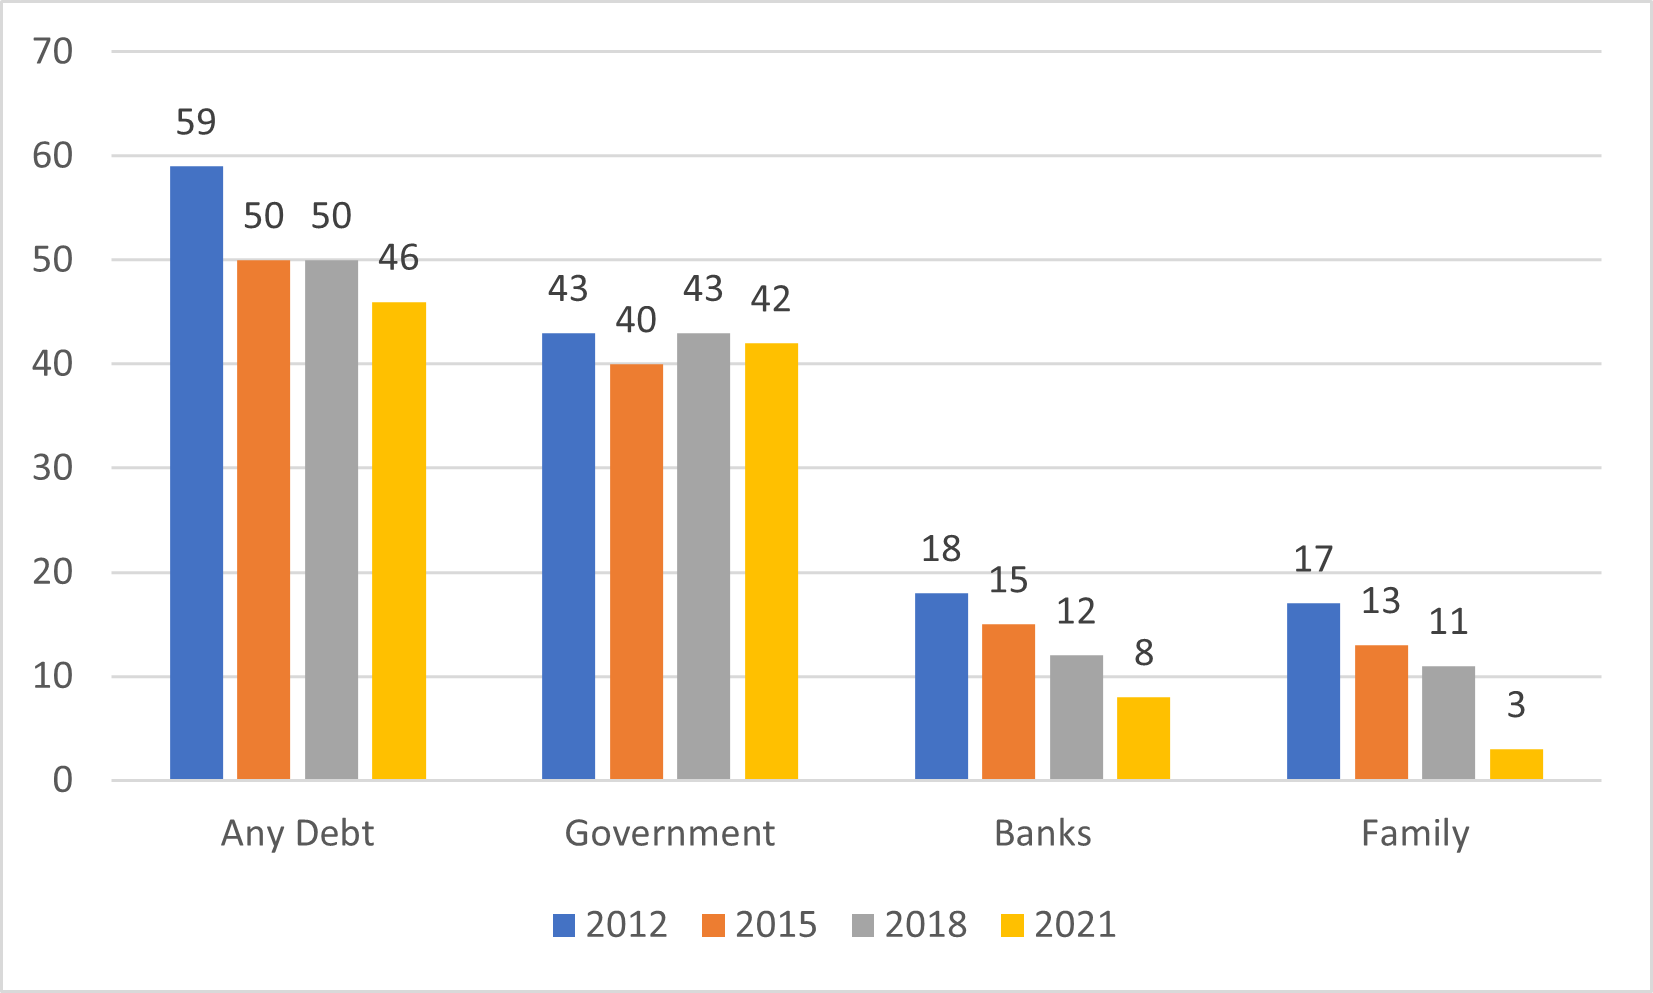
So, what does this year’s data say? Let’s start with the incidence of indebtedness. While the percentage of students borrowing from government seems relatively consistent over the last decade, the percentage of students claiming indebtedness to private sources – banks or family members – seems to have declined quite precipitously over the same period. As a consequence, the overall percentage of students with debt seems to declining slightly.
Figure 1: Incidence of Student Debt, by Source, 2012-2021
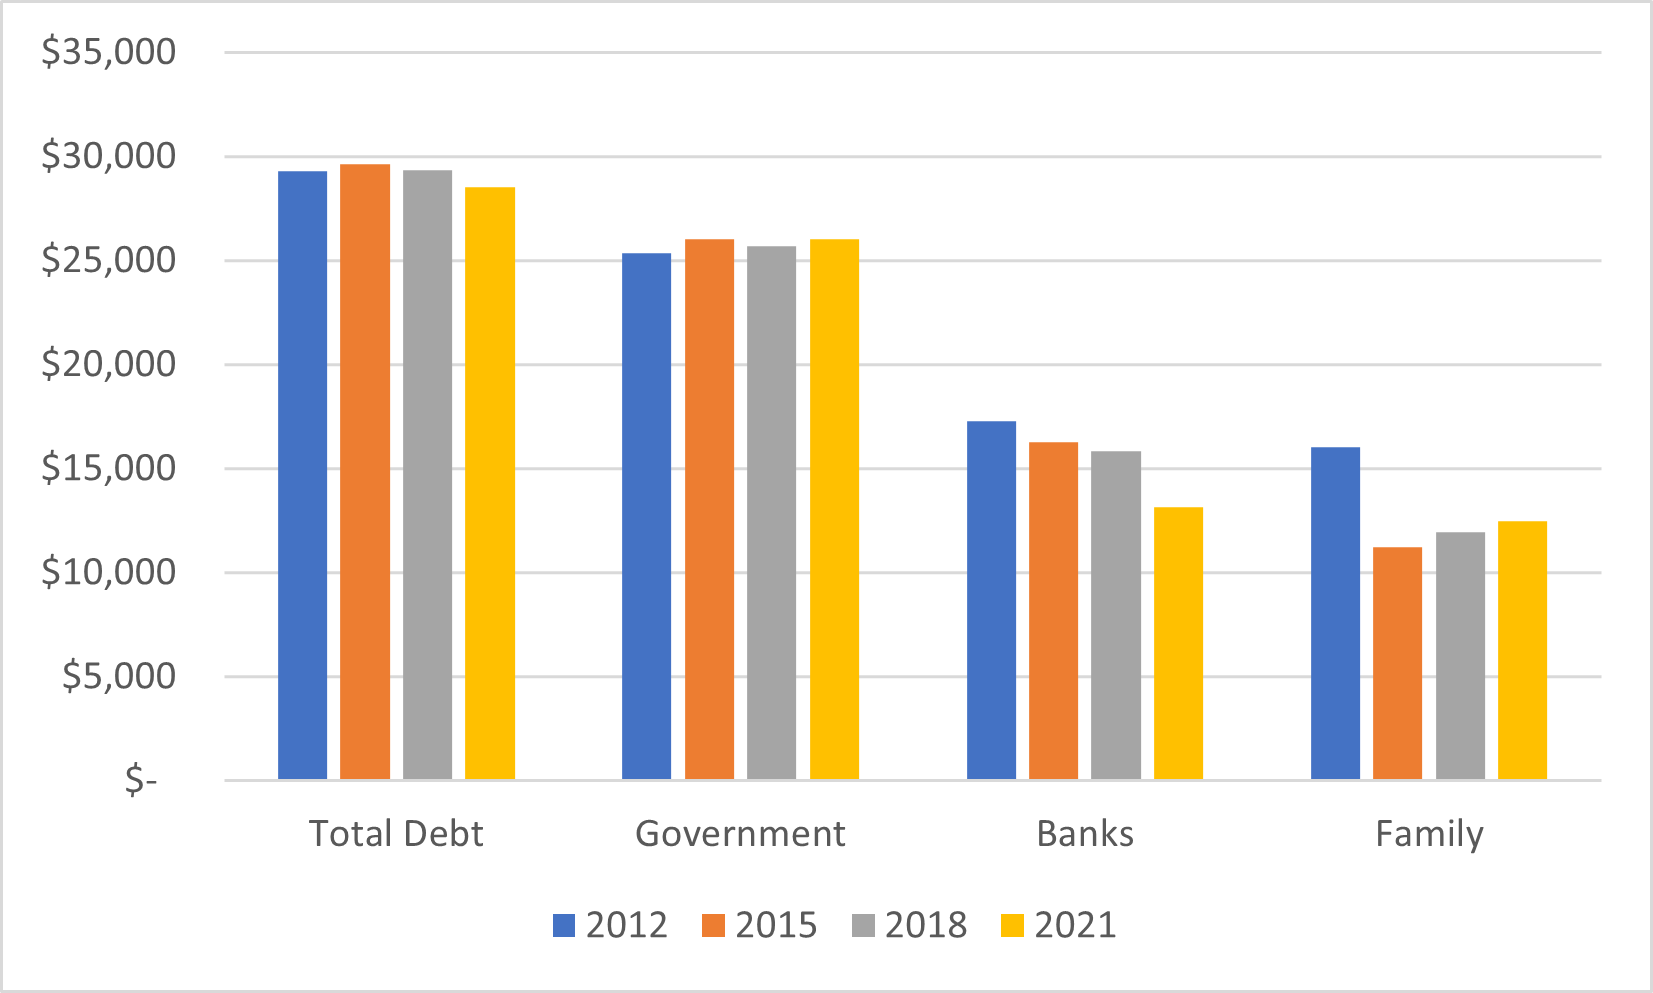
When it comes to the actual amount of debt among those who have it, we see a pattern of stability in constant dollar terms where debt from government is concerned (at roughly $25,000) and decline where debt from banks ($13,000) and family ($12,500) are concerned. Because government debt is by far the largest source of debt, the decline in private debt sources does not have much effect on overall average debt, which at $28,533 was at the lowest level in over a decade, but still very close to the long-term average of just under $30,000.
Figure 2: Average Debt by Source among Graduating Students, 2012-2021, in constant 2021 dollars
Overall this is consistent with the observation, which I made back here, that government expenditures on student aid – particularly grant-based student aid – have increased enormously over the past decade or so. The result, simply, is that tuition has increased but student debt has not. Or, to put it another way: the system is taking more money out of the hands of students of wealthier families, but is not taking money out of the hands of poorer students.
It should also be noted here that for those people who thought that a year of pandemic would make student debt go through the roof (less work, more borrowing, basically) that results are a bit inconclusive. This is because we don’t have data from 2019 and 2020. However, comparing 2018 to 2021 suggests that students are no worse off (despite, in Ontario, dealing with a much weaker student aid system after the 2019 OSAP cuts). It would seem, rather, that the doubling of CSLP student grants and the existence of the Canada Emergency Student Benefit were enough to keep students afloat without them incurring more debt.
In other words: the situation may not be great since total debt has not significantly shifted, but contrary to what you usually hear, it is not getting worse, and hasn’t been doing so for quite some time.

