


Canada is – to put it mildly – flat-out terrible at releasing student aid data. How many loans are issued? How many grants? In what amounts? These rather basic facts are unknowable from the public record. The government of Canada publishes statistics on the Canada Student Loans Program, which is good except that a) that’s only about 40% of the system and b) the most recent publication is from – and I wish I were kidding about this – 2016-17. Ditto the government of Quebec, whose key performance indicator for “transparency” is to publish one annual report every twelve months (the 2016-17 report has been up for 13 months, as far as I can tell). Everybody else? Apart from Saskatchewan (which does a lovely job) and Alberta (reports here) there is Zip. Nada. Bupkis. Occasionally you can get hints around total expenditures from nosing around ministerial business plans, annual reports on main estimates, and things like that, but apart from that basic data on student assistance is treated as a state secret.
So, this summer, we here at HESA Towers decided to do a little investigative work and filed some information requests. We managed to get pretty much all the data we were looking for, at least up to 2017-18, and many provinces gave us 2018-19. This data, plus some interpolation on CSLP for 2017-18, has allowed us to get a much fuller picture of student aid in Canada over the past few years. And the main conclusion, as you will see below, is that Ontario’s Targeted Free Tuition (TFT) Program made a phenomenal difference to affordability in Canada, quite unlike anything we have seen anywhere else in a long, long time.
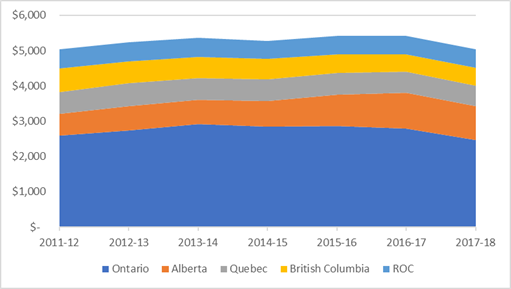
Let’s start out with the basics: provinces lent money to around 400,000 students in 2017-18, while the federal government issued loans to about three-quarters of a million students. The difference is largely accounted for by Ontario, where TFT program effectively eliminated provincial loans in 2017-18. In total, about $5 billion was given out in federal and provincial loans, which was about a 8% drop on the previous year. Ontario was slightly less than 50% of total loans; Alberta made up almost 20% of total loan volumes.
Figure 1: Total Government Student Loans by Issuer, Canada, 2011-12 to 2017-18, in constant $2019.
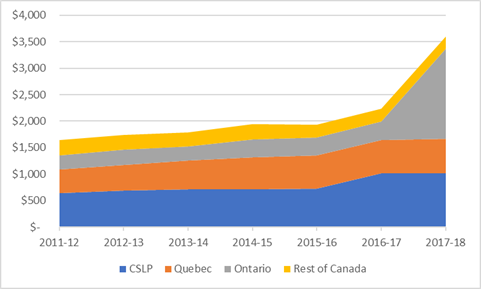
Now let’s look at grants. Here, what we see is that in 2017-18, Canadian governments gave out $3.5 billion in up-front, non-repayable aid. Roughly half of this came from Ontario, where grant spending jumped by $1.35 billion in a single year due to the TFT program. Less than a third of this was “new”; roughly $500 million came from a loan remission program and a similar amount came from abandoning a set of education tax credits, but nevertheless this was still the most consequential provincial policy change in student assistance in the last twenty-five years. The Government of Canada pays out another $1 billion or so, the Government of Quebec $650 million, and the other provinces combined another $230 million. This last figure excludes another $70 million or so in various loan remission programs (of which the most important is British Columbia’s), and another $110 million or so in merit-related aid, 90% of which comes from the Alberta government.
Figure 2: Total Government Student Grants by Issuer, Canada, 2011-12 to 2017-18, in constant $2019.
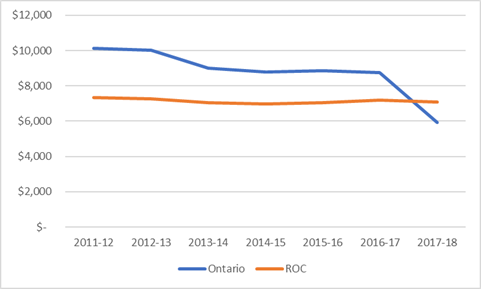
That Ontario data is pretty wild, right? Look what it meant for average borrowing in Ontario: basically, every student in Ontario on student aid got an extra $3000. Ontario went from being a high-borrowing province to a low-borrowing province pretty much overnight.
Figure 3: Estimated Average Government Loan (Combined Federal & Provincial), Ontario vs. Rest of Canada, 2011-12 to 2017-18, in constant $2019.
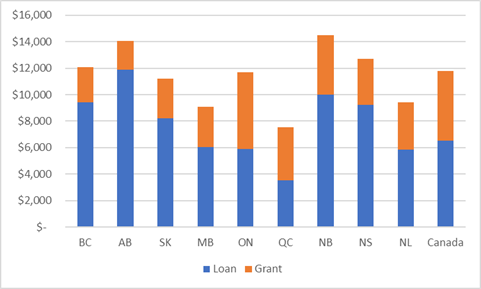
From all this data, one can attempt to make some guesses about what a “typical” student aid package looks like in each of the nine provinces where we have data. This is a little fraught because there’s no way to count unique loan and grant numbers. Provinces administer the federal program as well as their own and they are “integrated” in the sense that it only takes one application, but rules are not always parallel and this creates some difficulty in working out the correct number of students to use in the denominator. So, take figure 4 – which shows estimated annual average loans/grant per student aid recipient for – with a grain of salt. The exact dollar amounts are probably off a bit, but it is likely fairly accurate in terms of showing the relative generosity of each provincial program.
Perhaps the most intriguing finding in this figure is that Ontario and Quebec have near-identical 50-50 loan grant splits (though totals are higher in Ontario due to higher tuition). Also notable is the fact that students in Alberta have, by some distance, both the largest loans and smallest grants of any province (though if merit-based aid were included in the grants total, Alberta would probably look more like Saskatchewan and British Columbia would be the weakest on grants).
Figure 4: Estimated Average Government Need/Income-Based Loans and Grants (Combined Federal & Provincial) per student aid recipient by Province, 2017-18, in $2019.
Interesting, right? Of course, it’s all out of date because the Ford government kiboshed Ontario’s TFT program. No doubt we’ll be able to learn more about that in 12-18 months when that data finally gets collated.
Anyways, enjoy. We’ll be doing this annually from now on so the country can have some reasonably comprehensive public data on student aid. Just one more public service from your HESA Towers.

