


Co-authored with Tiffany MacLennan
Last week, I examined undergraduate student debt using data from the triennial survey of graduating students undertaken by the Canadian University Survey Consortium (CUSC). Today and tomorrow, along with Tiffany MacLennan (one of HESA’s many rockstar analysts), I am going to put that same data source to use to look at other aspects of university financing.
So, just to remind everyone: CUSC is a 20-something year-old coalition of the willing, which is roughly 30-odd institutions who choose to participate in an annual pan-Canadian student survey. The member institutions change every year, are almost exclusively anglophone, and over the past few years have increasingly come from the country’s smaller universities (which is very different from the early years when there was significant U-15 presence). CUSC works on a triennial basis: one year they do first-year students, the next year they do “middle-year” students and the next they do graduating students. I personally find the “middle years” survey as annoying as all get-out and much preferred it when, pre-2014, it was a survey of all undergraduate students which, you know, could be generalized to something meaningful. But it’s their survey, not ours, so one shouldn’t complain.
Two things make this series less than fully reliable as a time series (which is how we are attempting to use it here). The first is, obviously, that the membership changes over time. The second is that the CUSC membership fiddles with the questions a lot. This is understandable – this survey is designed to help (mostly) student affairs professionals look at how their institution is doing in comparison to similar institutions elsewhere, the issues with which they are concerned change over time, and so it is natural that the survey change somewhat from one year to the next. But boy howdy is it irritating if you want to use these surveys to see change over time. This would be less of a problem if Statscan and ESDC invested in high-quality student data. But this is Canada, so of course that’s not happening and CUSC is the best we’ve got.
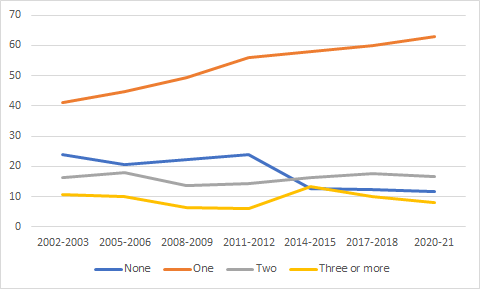
Despite the slightly wonky survey schedule It is possible to get something like a picture of the full student body by combining weighted observations across the different surveys, at least in those cases where the questions are worded similarly. Our technique here is a bit back-of-the-envelope, so don’t take any of the specific percentages presented here as gospel; instead, just focus on the trends shown, which are a bit more reliable. Anyways, on to the show. Let’s start by looking at student credit card use. Using a weighted combination of the undergraduate year/middle years and graduating years surveys, Figure 1 gives you a broad sense of how many credit cards students have had over the past two decades (note the big fall in 2014 – that’s the switch from “all years” to “middle-years” and the loss of first-year students who are less likely to have a credit-card. Can’t be helped). Even setting aside the 2014 anomaly, the percentage of students with at least one card has increased in most survey periods, and in 2020-21, close to 90% of all students had at least one.
Figure 1: Number of Credit Cards Held by Canadian Students, 2002-3 to 2020-1 Survey Cycles
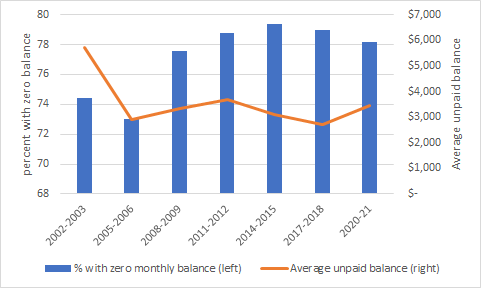
So does this mean Canadian students are becoming more heavily burdened by credit card debt? It does not seem so. The percentage of students saying they pay off their balances monthly has stayed pretty constantly in the high-70 percent range since 2008-9, and the amount owing for those students with balances seems to be pretty stable in the $2500-$3500 range.
Figure 2: Monthly Balances on Credit Cards Held by Canadian Students in constant $2020, 2002-3 to 2020-1 Survey Cycles
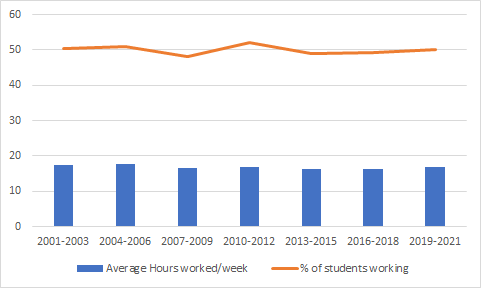
Another important trend to look at over time is students’ employment patterns, both in terms of the percentage of students working, and the number of hours worked. There’s an assumption that “of course, students are working more than they used to”, but the data do not bear out this assumption. According to data from the CUSC survey (which in this case includes data from the first-year survey, because the questions are consistent across all three instruments) the percentage of students who work regularly during the school year is around 50% and has been for 20 years. If you go back through Statscan data, you’ll find it more or less unchanged back into the 80s as well. As for the average number of hours worked, that too looks consistent using a weighted average of the three CUSC surveys across seven survey cycles: roughly 17 hours per week, (basically equivalent to one day shift on the weekend and two evening shifts during the week, which is a pretty common pattern for students in the service industry).
Figure 3: Average Hours of Work and Student Pay, 2001-03 to 2019-21 Survey Cycles
(If you are wondering why the last set of observations are unaffected, given COVID and all, the answer is, first, the 2020 survey was mostly conducted before the COVID shutdown and second, that 2021 was not in fact very far out of the ordinary as far as student employment was concerned. Statscan data tends to confirm the latter observation, as I will show in a post sometime next month).
In any event, there is a lot more data to play around with in the CUSC archives, which you can browse here, but that’s about it for truly comparable data on student finance (there is some vaguely comparable stuff on student income but the data on employment income is weirdly low in the early 2000s which makes trend data very unreliable). There is, however, a lot more data on students’ social and academic experiences, and that’s what we’ll turn to tomorrow.

