




Morning all. A couple of weeks ago, I told you I’d be spending a good number of blogs this year looking at provincial higher education systems and how they are doing. I’m going west-to-east and today it’s Alberta’s turn.
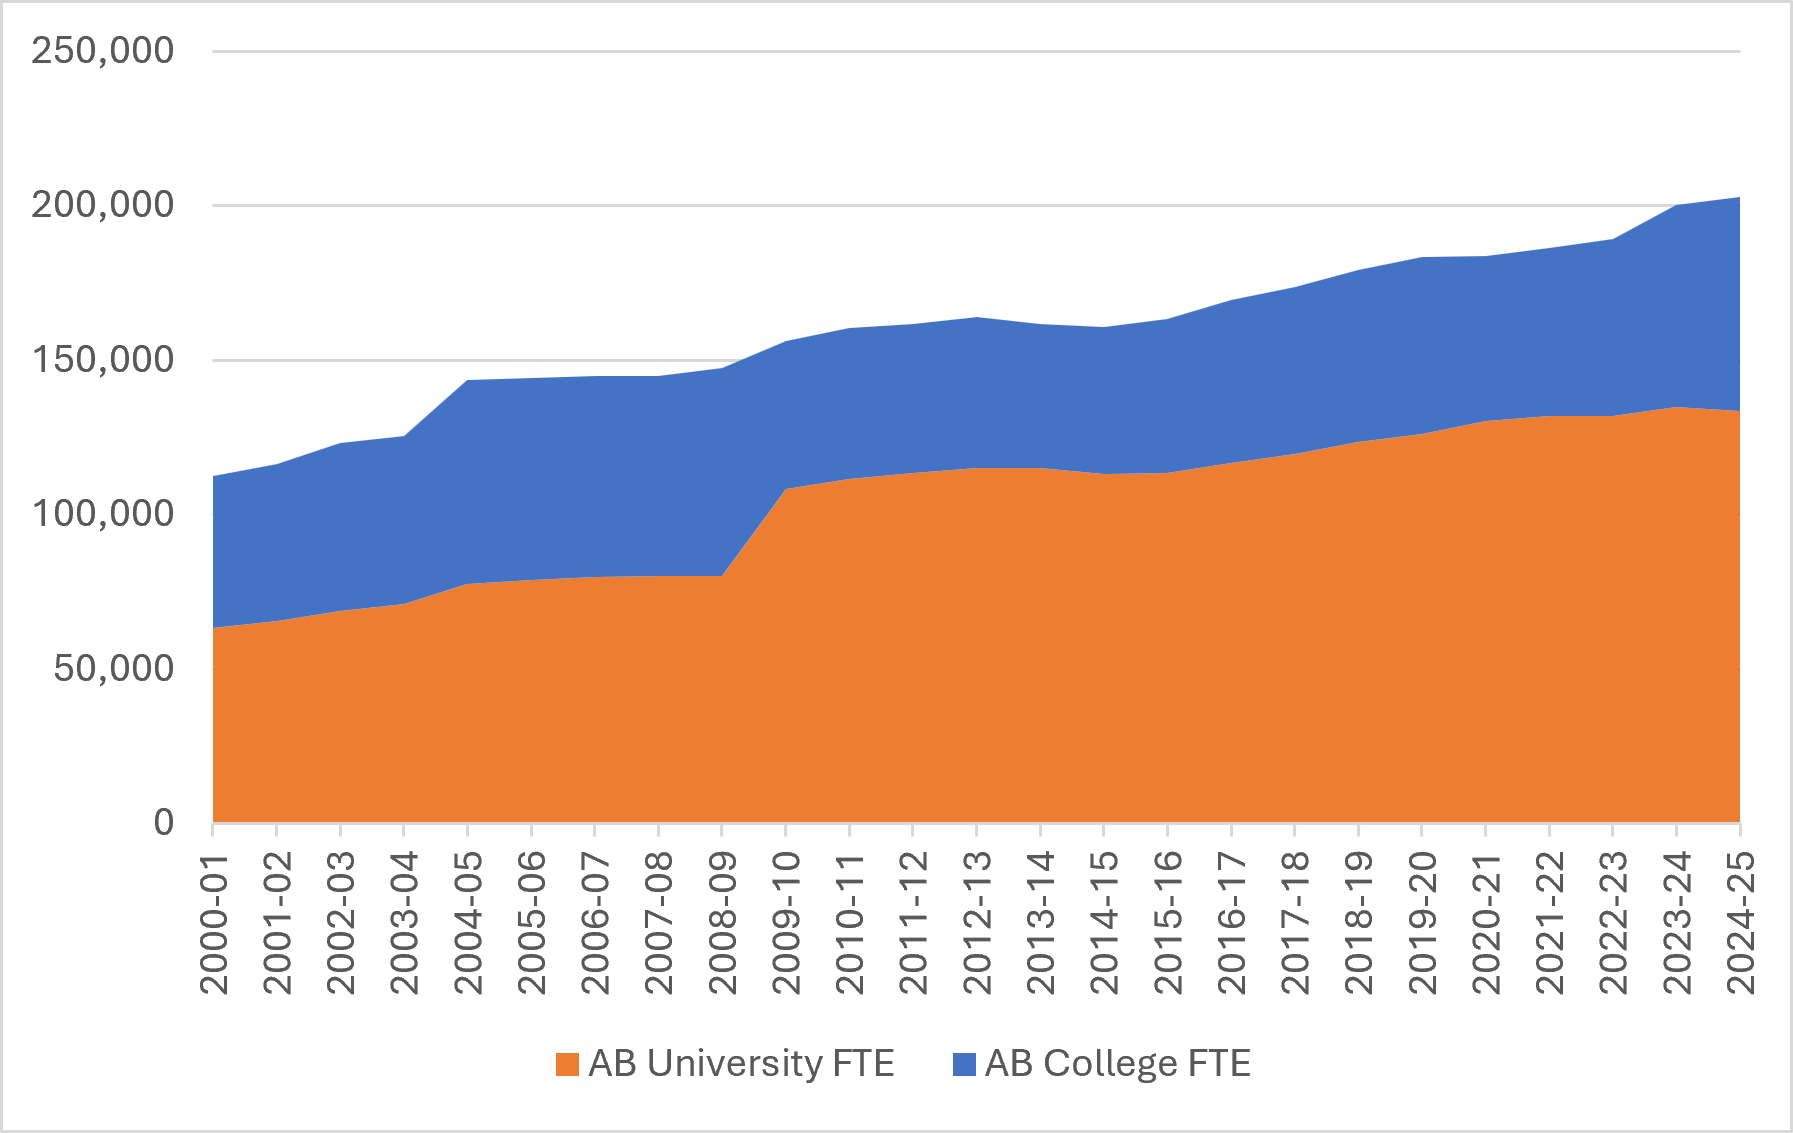
As figure 1 shows, overall enrollment in Alberta post-secondary institutions is up by just over 80% since the turn of the century. The graph makes it appears as though most of the growth has been in universities, and that’s true in a sense, but the big shift in enrolments in the aughts was mostly due to two institutions (Mount Royal and MacEwan) having their designation switched from “college” to “university” by the provincial government. Alberta’s 80% growth rate is slightly ahead of the national average increase of 71%.
Figure 1: Enrolment by Institution Type, Alberta, 2000-01 to 2024-25
Figures 2 and 3 show the percentage of international students in Alberta’s college and university systems respectively (note: the data runs out here just before the collapse in international student numbers, so this is enrolment at the peak rather than enrolment today). Alberta was less exposed than most provinces to international students, and so the plunge in international student numbers has been less consequential there than in many other provinces. In the college sector, 27% of all students were international students, well below the national average of 36%. In the university sector, the equivalent was 14%, which was not just lower than the national average of 21% but the lowest of any province in the country, full stop.
Figure 2: International Students’ Share of College Enrolment, Alberta, 2000-01 to 2023-24
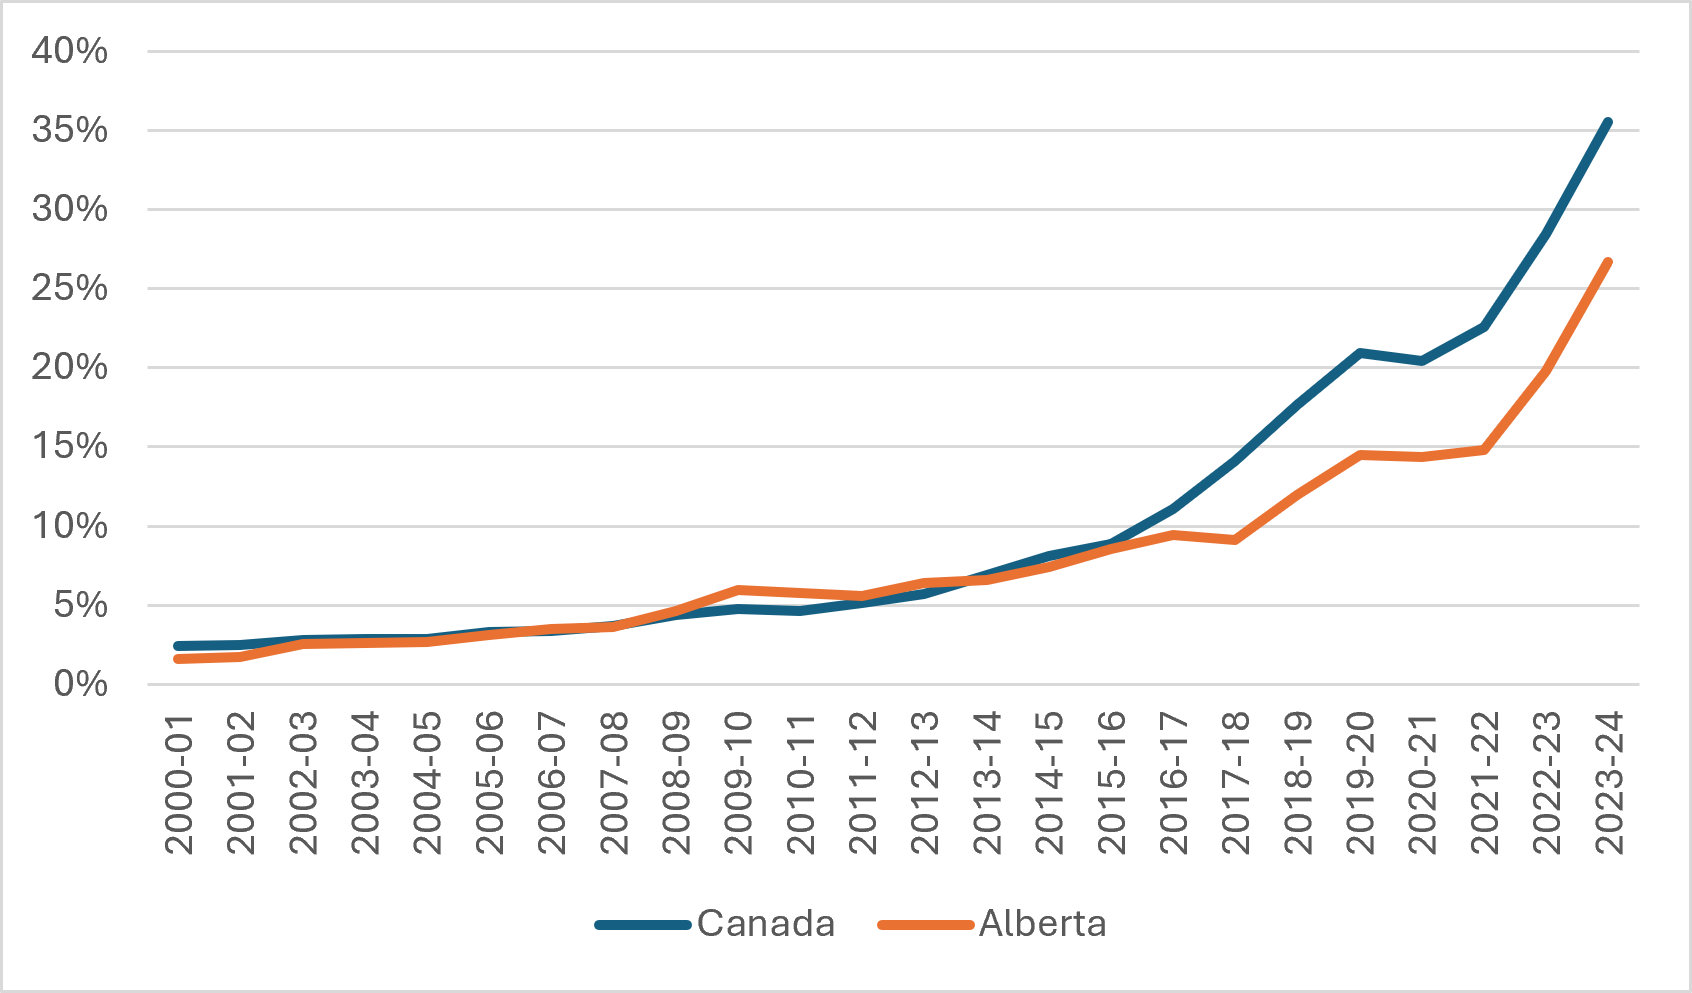
Figure 3: International Students’ Share of University Enrolment, Alberta, 2000-01 to 2023-24
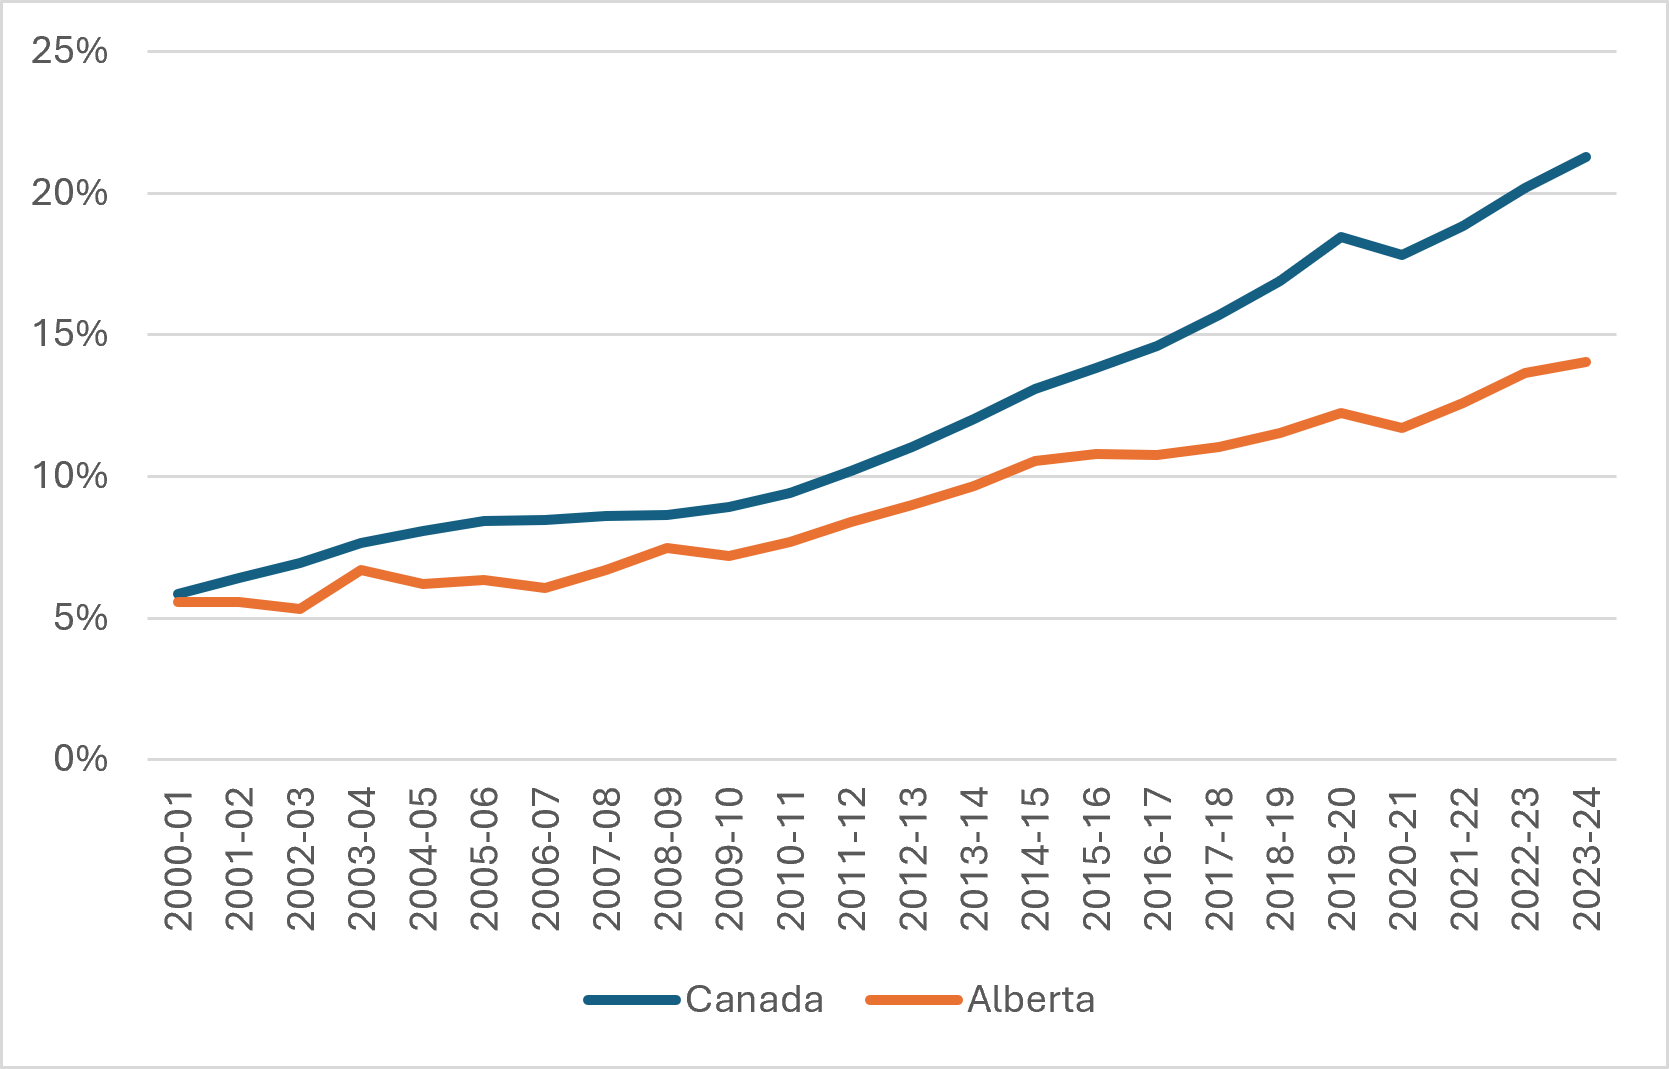
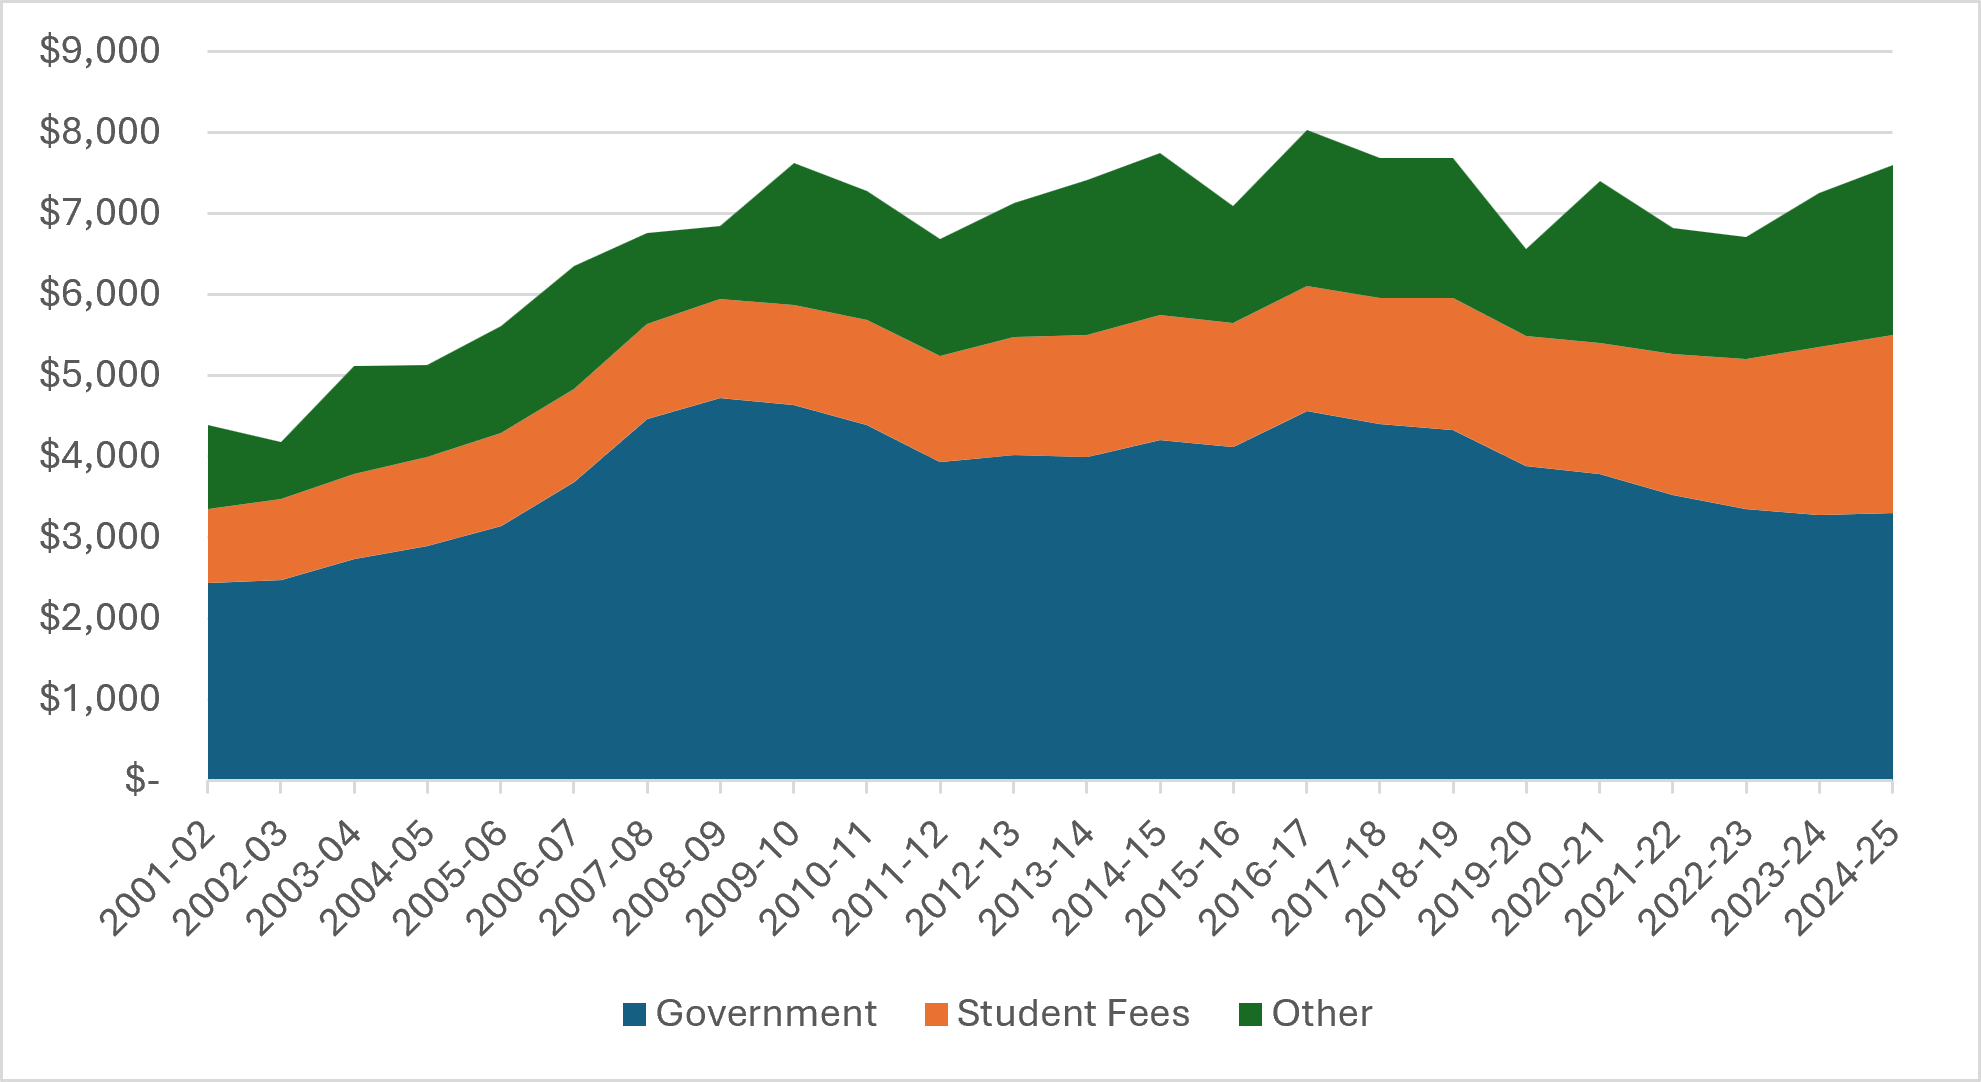
Figure 4 shows total institutional revenue over time and by source, in millions of constant 2024 dollars. Alberta’s path here is totally unlike any other province. Total income has grown by 73% this century after inflation, which is close to the national average; however, what is different in Alberta is the fact that all that growth essentially occurred in the first decade of the century and there has been no net increase in the intervening fifteen years. The key reason for both the growth and the decline is public spending, which rose in real terms by 90% across the 2000s, and have since fallen by 28%.
Figure 4: Total Revenue by Source, Alberta Colleges and Universities, in Millions of $2024, 2001-2002 to 2024-2025
The relative financial position of Alberta’s colleges and universities can be seen in Figure 5. Colleges in Alberta are somewhat better-funded than colleges in the rest of the country, while universities are somewhat worse-funded. In both cases, public funding is pretty close to the national average, even after that big 28% drop (how? Because fifteen years ago, Alberta had by far the best-funded system in the country, and all those cuts just brought institutions down to roughly the national average). The difference between college and universities actually lies in student fee income: in colleges, these are above the national average, while in universities, they are below. This is partly because of the phenomenon noted in figures 2 and 3 – international students and their higher fees are a bigger part of the student mix in colleges than they are in universities.
Figure 5: Per-FTE Income by Institution-Type, Alberta vs. Rest of Canada, 2024-5
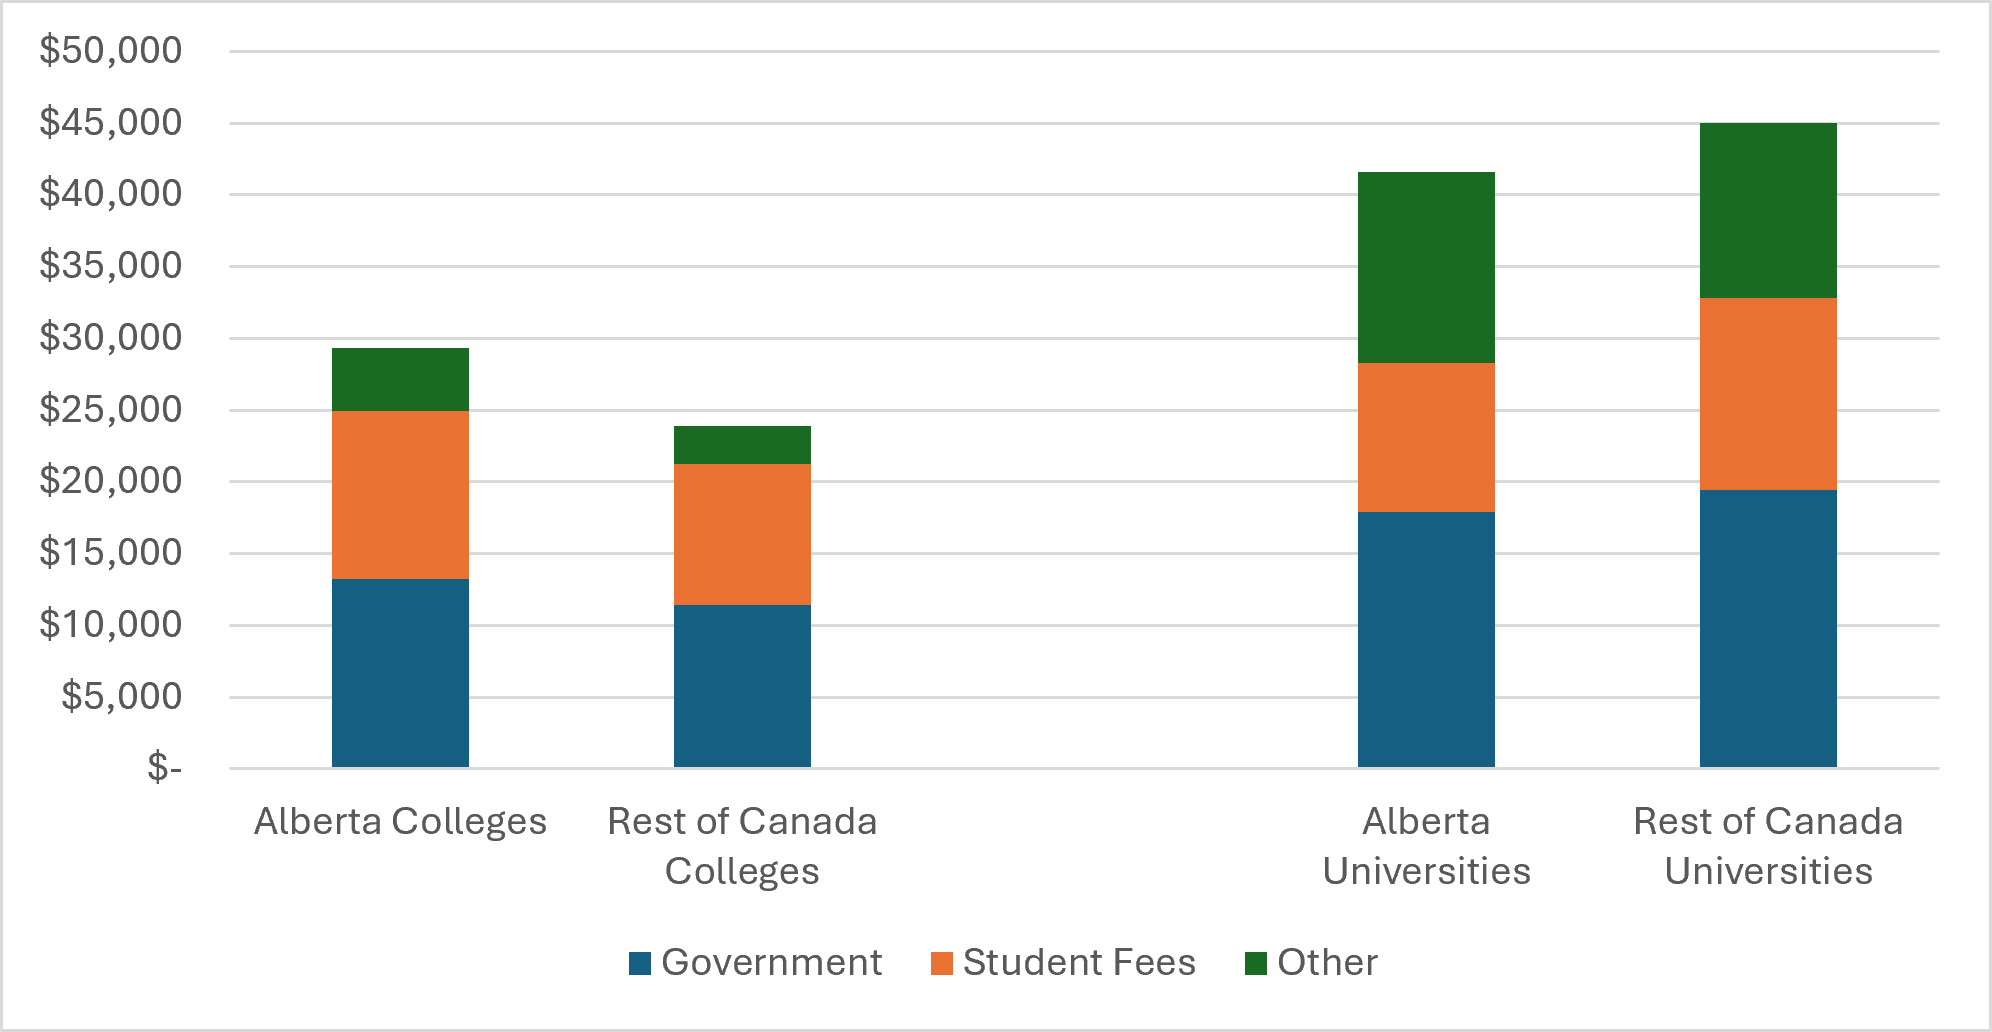
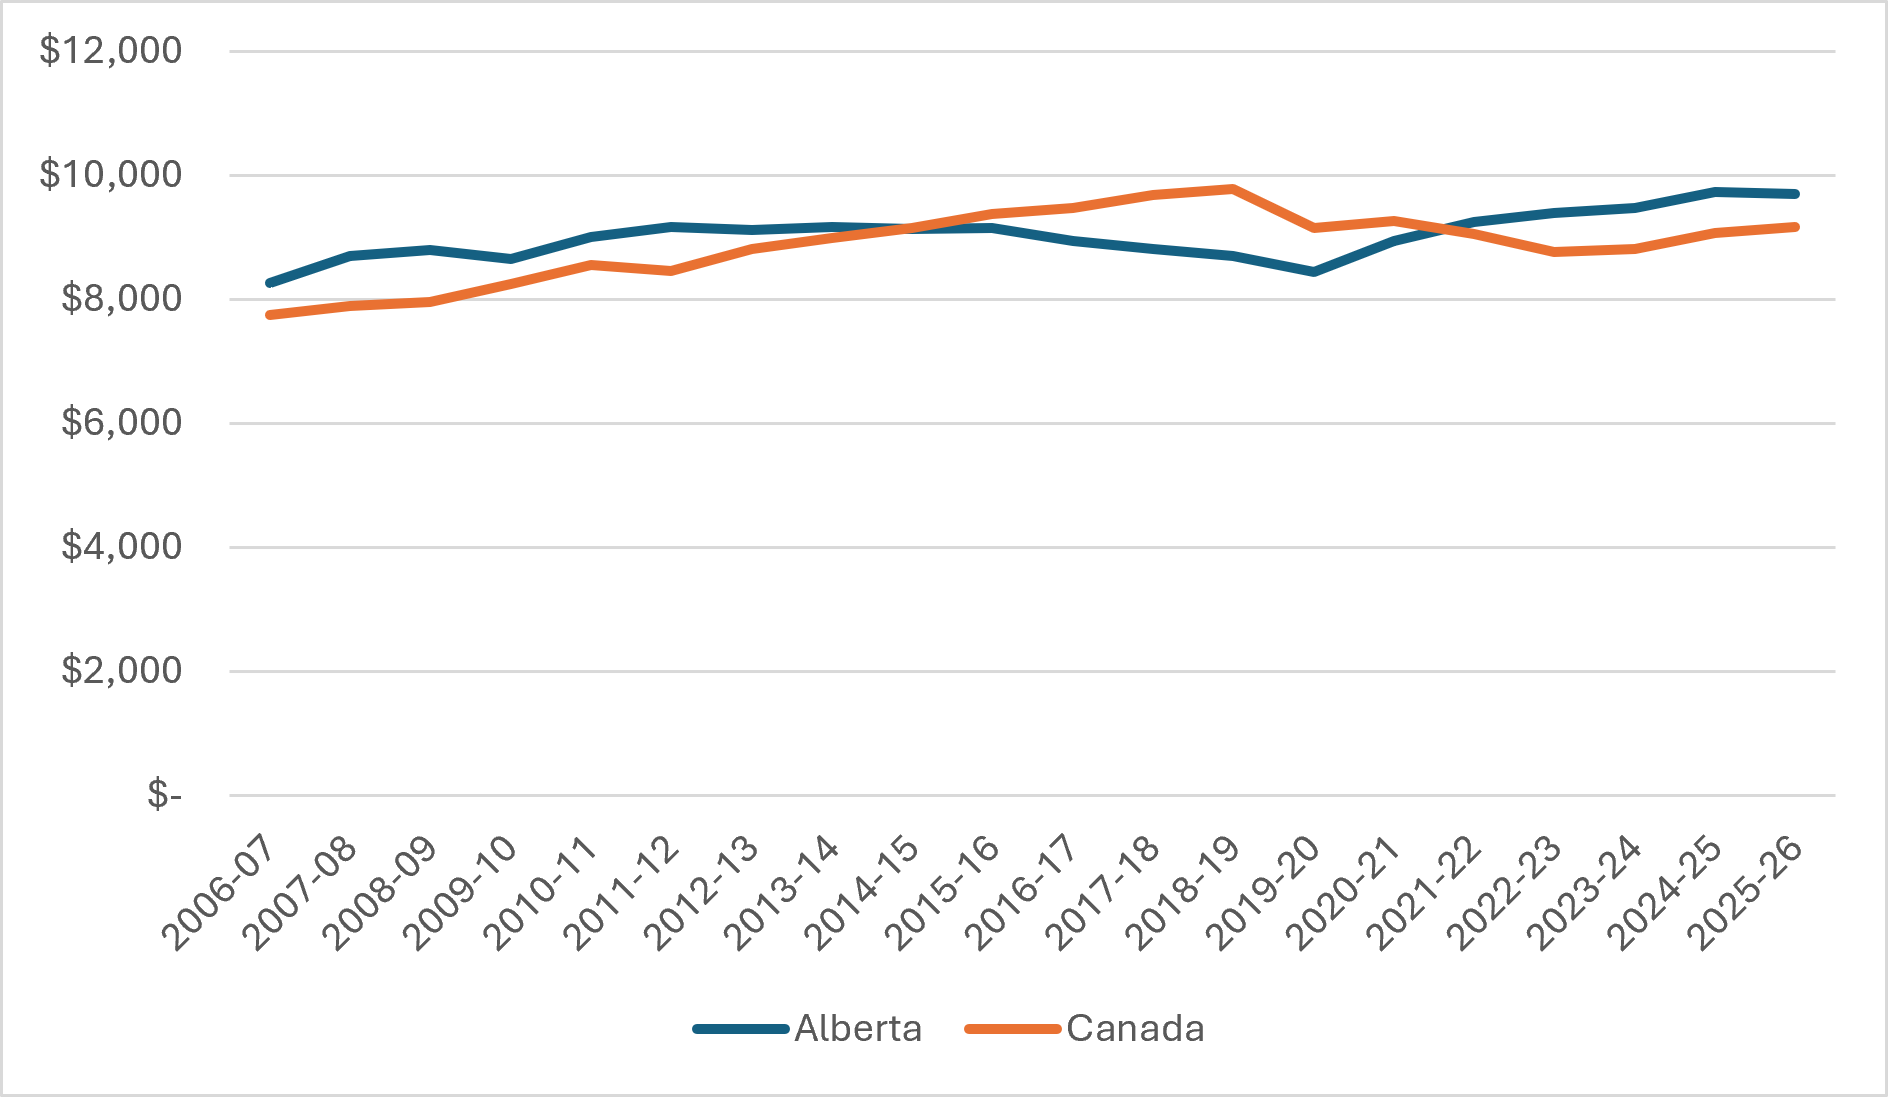
Figure 6 shows tuition fees in constant dollars, both for Alberta and Canada. It’s not a particularly interesting graph because the relationship it shows is pretty stable: for the past twenty years, annual domestic tuition fees have been with a couple of hundred dollars of the national average.
Figure 6: Domestic Undergraduate Tuition Fees in Constant Dollars, Alberta vs Canada, 2006-07 to 2025-26
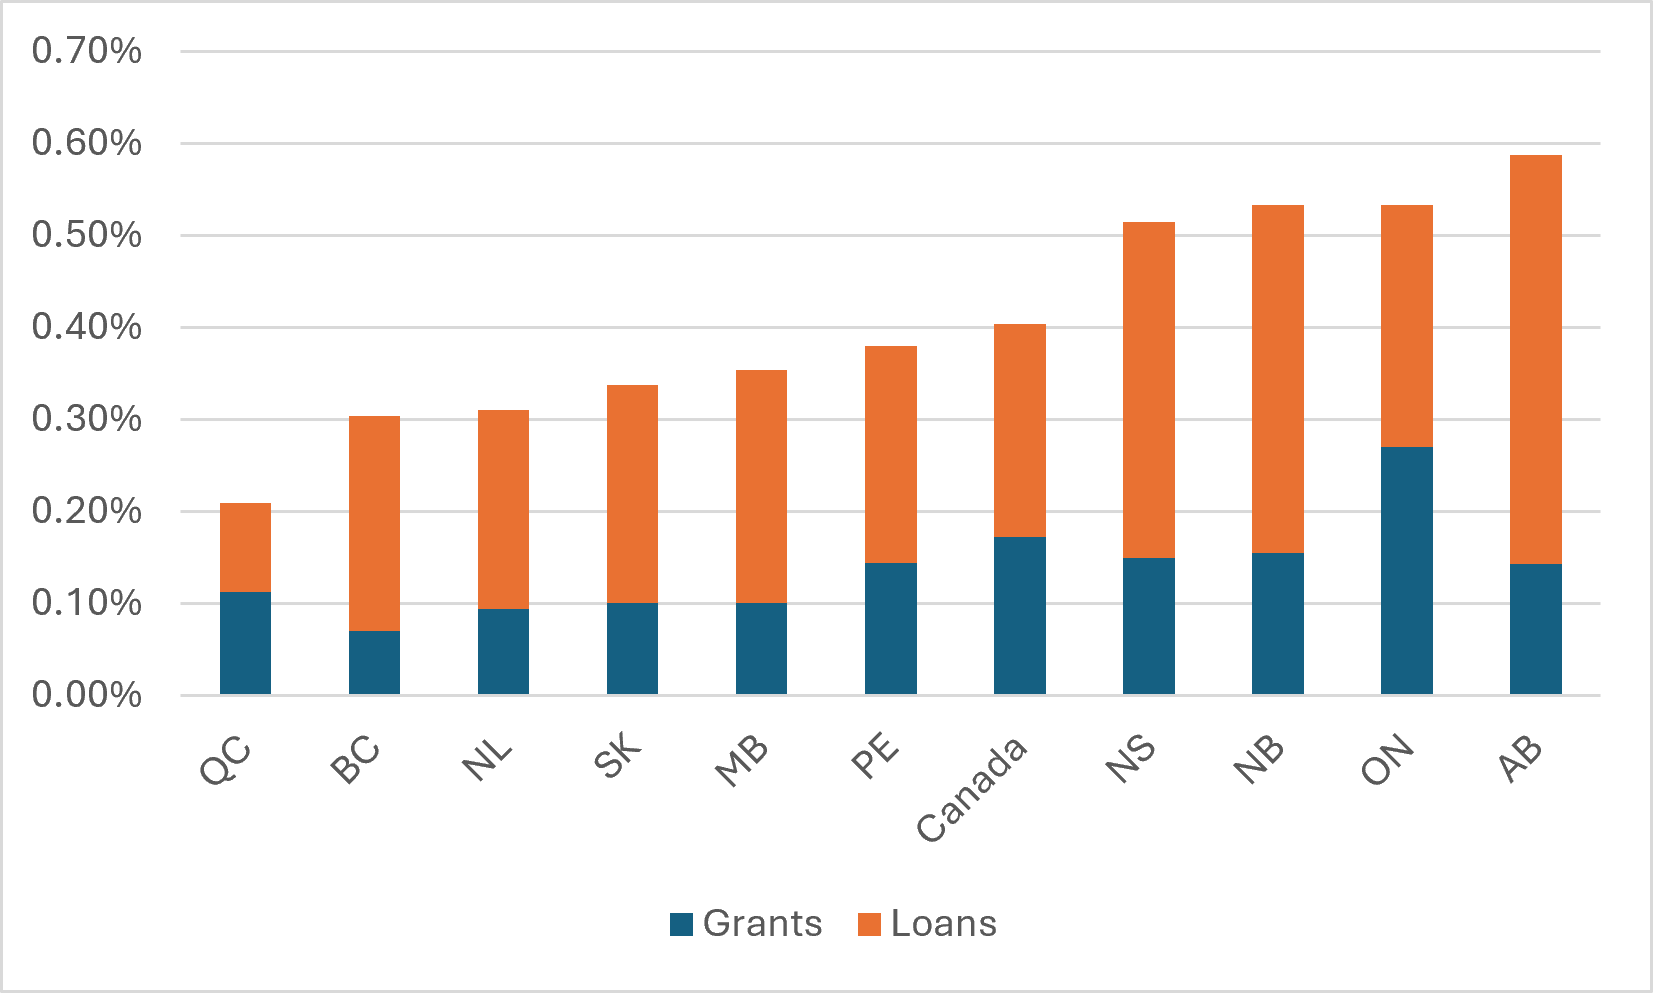
And finally, there is figure 7, which shows student assistance (from provincial and federal aid programs combined) by type over time, and figure 8, which compares student aid across the whole country. The relative generosity of a student aid system is partly about the number of people it serves and partly about the amount of money it gives to students; these figures show aid by type as a percentage of gross domestic product instead of per-student, because that is the easiest and most accurate way to include both aspects of generosity into a single measure which is comparable across all provinces. Student assistance in Alberta makes up a bigger part of the economy than in any other province. In terms of grant aid (which in this province is almost entirely provided by the federal government and no the province), Alberta is actually a little bit below the national average. In terms of loan aid, it provides the highest amount of any province in Canada. That makes life a little more comfortable for students, but it also contributes to very high levels of post-graduation indebtedness.
Figure 7: Total Need-Based Student Assistance by Type as a Percentage of GDP, Alberta, 2011-12 to 2024-25
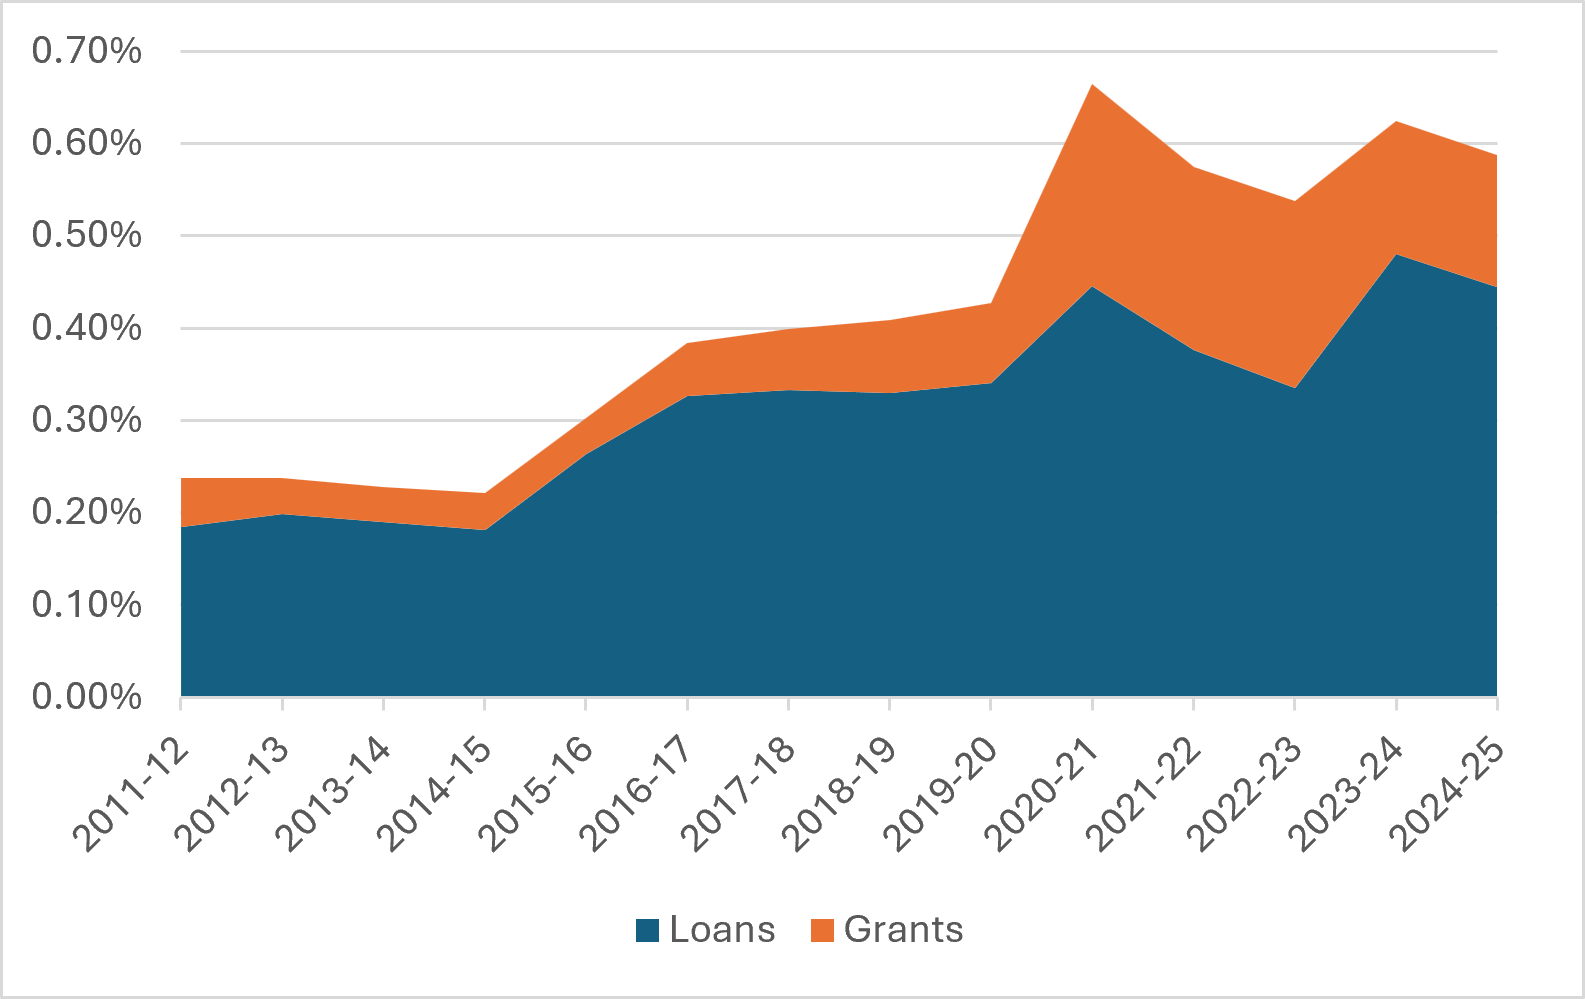
Figure 8: Total Need-Based Student Assistance by Type as a Percentage of GDP, by Province, 2024-25
So, there you have it. If you look at Alberta only through the lens of today, what you see is a province which looks pretty close to the national average in most ways, except perhaps for its use of student loans. If you look at Alberta through the lens of history, what you see is a province that went from Canadian champion to middle-of-the-pack pretty quickly, beginning around the time the NDP came to power in 2015 and accelerating after the UCP took office in 2019. Its champion status was, of course, based on income from hydrocarbons: the astonishing increase in public funding came during the years when oil prices were increasing. Most government policy in the last decade or so has been about trying to make higher education fit the budget of province’s post-oil-boom economy, effectively trading in a Lexus-qualty post-secondary system for a more sensible Honda.