


Let’s take a look at administrative bloat. It’s been about four and a half years since we last did it: time for another look.
Now, the typical story we hear about administrative bloat concerns the huge numbers of administrative and support staff (henceforth, “A&S Staff”) hired, in contrast to the ranks of the professoriate, which are constantly decimated by predatory managers and yadda yadda. The second part of that is reasonably easy to de-bunk, as Statistics Canada actually publishes data on total number of full-time academic staff and that number is growing, nor shrinking (as I pointed out back here). But because there are no national statistics on A&S staff, people can make up whatever story they want, and that narrative continues unabated.
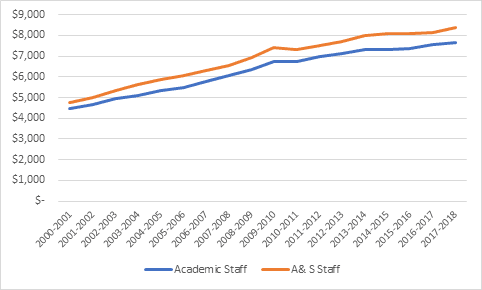
Well, while there are no national statistics on how many A&S staff there are, there are certainly statistics on how much money is spent paying A&S staff, and these can be tracked over time through Statistics Canada’s Financial Information of Universities and Colleges (FIUC) Survey. Figure 1 shows the basic story: yes, A&S staff are paid on aggregate more than academic staff, but this has been true for at least twenty years, and the overall pattern of compensation increases are pretty similar. Total A&S staff compensation has been increasing at a rate of inflation plus 3.4%, while aggregate compensation for academic staff has been increasing at inflation plus 3.2%.
Figure 1: Total Wage Compensation to Academic and A&S Staff, 2000-01 to 2017-18, in millions of constant 2017 dollars
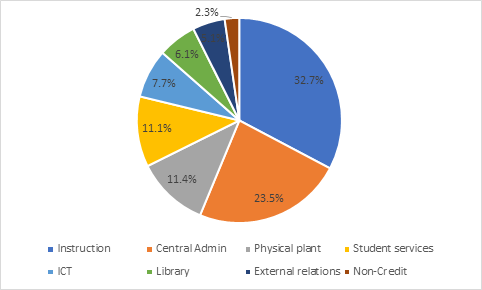
Roughly 80% of the A&S Staff compensation occurs inside the operating budget. Of this, approximately one-third goes to non-academic staff who in one way or another report to a Faculty Dean (this is meant in the FIUC data by the term “Instructional & non-sponsored research”, or just, as in Figure 2 below, “instruction”). Another quarter or so goes to the dreaded “central administration”, and another 23% is split between student services and physical plant. The remainder is split between ICT, Libraries, “external relations” (basically government & community relations plus fundraising), and “non-credit instruction (i.e. continuing education).
Figure 2: Distribution of A&S Operating Budget Salaries, by Function, 2017-18
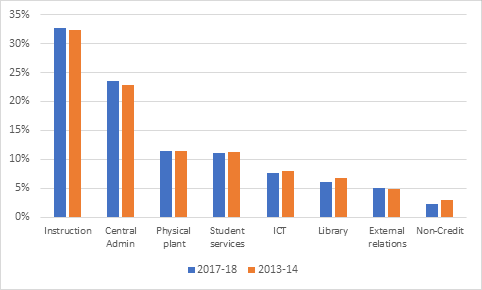
Has any of this changed very much since the last time we looked at this before? As Figure 3 shows, the answer is one big “nope”. Central admins takes up a slightly bigger share (my guess is this has mostly to do with increased costs related to marketing and international recruitment), as does instruction; this comes mainly at the expense of libraries (it’s always libraries taking it on the nose, have you noticed this?) and non-credit instruction.
Figure 3: Change in Share of A&S Staff Salaries by Function, 2013-14 vs 2017-18
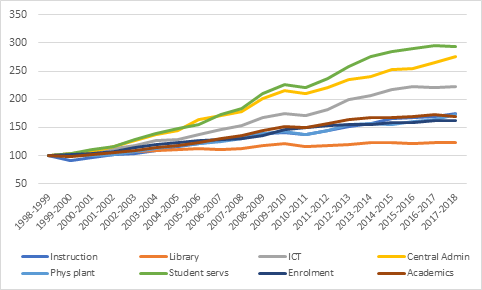
If we apply a longer (twenty-year) lens to look at changes in A&S staff expenditures by category – as we do in Figure 4 – we see that over the very long term, only three elements of A&S Staff spending actually exceed increased spending on academics. First, by quite some distance, is new spending on student services. Second – and we’ll come back to this in a second – “central administration” expenditures, and third, probably no surprise, is expenditures on staff related to computers, software, and communications.
Figure 4: Changes in Wage Expenditures by Category, over 20 years, (1998-99=100)
Now, one can still look at this and say “hey, there’s still bloat in that one category of central administration”. Which, you know, sure, if that floats your boat. One could make the argument that central admin expenditures should have grown at the same level as academic wage expenditures, in which case universities would have “saved” about $800 million dollars. But on the other hand, these extra dollars have gone to fundraising, government relations and increased international student recruitment, all of which have been instrumental in keeping institutional income rowing at about 2% per year above inflation. So possibly this is money well spent? I may return to this topic in the next couple of weeks.
In any case, tl;dr, there’s not much of a case for saying that administrative bloat is driving cost increases in Canadian higher education – or at least, administrative salaries are not more culpable than academic ones.


2 Responses
So this is just universities?
Interesting “Thought” today. Here are a couple of additional possibilities for the relative growth of salary costs associated with central admins: increased accountability requirements from both the provincial level and federal level (research funding); and increased complexity of funding mechanisms (e.g., Strategic Mandate Agreement in Ontario, Canada Foundation for Innovation funding contingent on securing matches).