


The Globe’s Gary Mason wrote an interesting article yesterday about the Gupta resignation. Actually, let me qualify: he wrote a very odd article, which ignored basically everything his Globe colleagues Simona Chiose and Frances Bula had reported the previous week, in order to peddle a tale in which the UBC Board fired Gupta for wanting to reduce administrative costs. This, frankly, sounds insane. But Mason’s article did include some very eye-opening statistics on the increase of administrative staff at UBC over the past few years – such as the fact that, between 2009-10 and 2014-15, professional administrative staff numbers increased by 737, while academic staff numbers increased by only 28. Eye-opening stuff.
And so, this seems as good a time as any to start sharing some of the institution-by-institution statistics on administrative & support (A&S) staff I’ve been putting together, which I think you will find kind of interesting. But before I do that, I want to show you some national-level data that is of interest. Not on actual staff numbers, mind you – that data doesn’t exist nationally. However, through the annual CAUBO/Statscan Financial Information of Universities and Colleges (FIUC) survey, we can track how much we pay staff in various university functions. And that gives us a way to look at where, within the university, administrative growth is occurring.
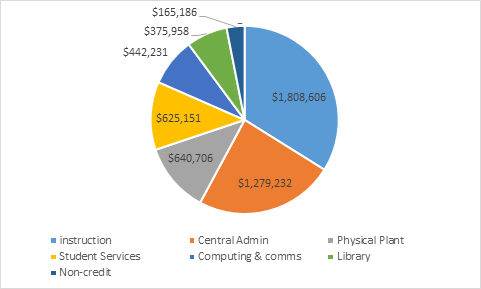
FIUC tracks both “academic” salaries and “other” (i.e. A&S) salaries across seven categories: “Instruction & Non-Sponsored Research” (i.e. at the faculty level); “Non-Credit Instruction” (i.e. cont. ed); “Library, Computing, and Communications”; “Physical Plant”; “Student Services”; “External Relations” (i.e. Government Relations plus Advancement); and, “Administration” (i.e. central administration). Figure 1 shows the distribution of A&S salary expenditures across these different categories for 2013-14. A little over 32% of total money is spent on faculty, while another 23% is spent in central administration. Physical plant and student services account for about 11% apiece, while the remaining three areas account for 18% combined.
Figure 1: Distribution of A&S Salaries by Function, in 000s of Dollars, Canada, 2013-14
A zoom-in on the figures for central administration is warranted, as there has been some definitional change over time, which makes time-series analyses a bit tricky. Back in 1998, the reporting rules were changed in a way that increased reported costs by about 30%. Then, in 2003, about 15% of this category was hacked-off to create a new category: “external relations” – presumably because institutions wanted to draw a distinction between bits of central administration that increased revenues, and those that consumed them. Figure 2 shows how that looks, over time.
Figure 2: Expenditure on Administrative & Support Salaries in Central Administration, in 000s of 2014 Real Dollars, Canada
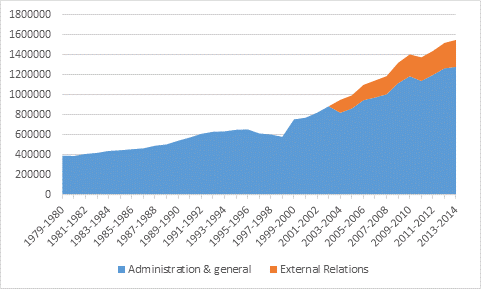
Long story short: from the 80s through to the mid-90s, administrative & support salaries in central administration rose by a little over 3% per year in real terms. Then, briefly, they fell for a couple of years, before resuming an upward trend. Ignoring the one-time upward re-adjustment, aggregate A&S salaries in these two areas combined have been rising at 5.3%, after inflation, since 1999. Which is, you know, a lot.
Now, let’s look at what’s been going on across the university as a whole. Figure 3 shows changes in total A&S salary paid over time, relative to a 1979 base. For this graph, I dropped the “non-credit” category (because it’s trivial); for central admin, I’ve both combined it with “external relations”, and corrected for the 1998 definitional change. Also, for reference, I’ve included two dotted lines, which represent change in student numbers (in red), and change in total academic salary mass (in yellow).
Figure 3: Change in Real Total Academic & Support Salary Spending (1979-80 = 100) by Function, Canada
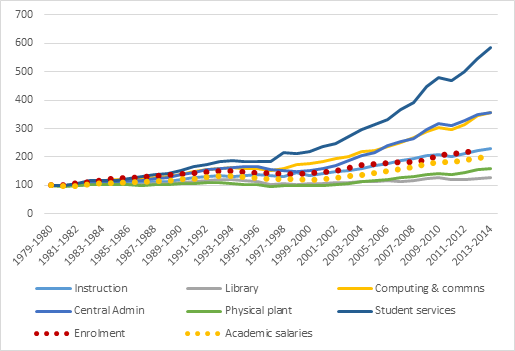
Since 1979, student FTEs rose 120%, while academic salary mass doubled, after inflation. A&S spending in libraries and physical plant rose by considerably less than this, by 27% and 57%, respectively. A&S spending on “instruction” (that is, faculty & departmental offices) rose almost exactly in tandem with student numbers. Spending on A&S salaries in central admin and in ICT rose about twice as fast as that, ending the 35-year period at three-and-a-half times their original rate. But the really huge increases occurred in student services, where expenditures on A&S salaries are now six times as high as they were in 1979.
Over the next couple of weeks, I’ll be able to supplement this picture with institutional data, but the key take-aways for now are as follows: i) “central administration” salaries are growing substantially faster than enrolment and academic salary mass, but they represent less than a quarter of total A&S spending; ii) the largest component of A&S spending – that is, those reporting to academic Deans – is actually growing exactly on pace with enrolment; and, iii) the fastest-growing component of A&S spending is student services. So, there has been a shift in A&S spending, but it’s not entirely to the bad, unless you’ve got a thing against student services.
More next week.


9 Responses
Another thing, non-union admin and such support are easy to fire immediately.
CUPE (the usual support staff at Unis) have contracts that make it difficult to fire/let go. The Uni has to try to find an alternative job for the people, and really, really discontinue a service to let CUPE staff go.
Thus the bulk up of Admin who do similar work to senior CUPE members work (above basic lab-techs, clericals etc.)
I wonder if this has to do with something you’ve mentioned in a previous blog post, about the difficulty of changing institutions, and specifically faculty behaviour. It must be easier, after all, to just increase the size of functions under direct administrative control.
So, for an example, one could try to monkey with incentives to get professors to take actions to increase student retention, but it’s easier to create a retention program in student services.
Bingo. I don;t think that;s the whole story, but it’s part of it.
I think the “student services” category needs de-constucting. I suppose that universities include their – growing – expenditure for recruiting students from abroad into this envelop which however has little to do with student services in the classical sense of the term.
Hi Hans. Thanks for writing. In fact, everything to do with registrarial and admissions offices comes under “Administration & General” in CAUBO, which is what I renamed “central administration” here. Guidelines for reporting may be found here: http://www.caubo.ca/sites/137.149.200.5.pilot/files/Guidelines%202012-2013%20%28CAUBO%29.pdf
Hi Alex,
The CAUBO “academic ranks” salary bin includes Deans, Associate Deans, Assistant Deans, etc., who, despite not being part of the faculty’s bargaining unit while Deanly, maintain a faculty rank in name only so that they can return to the bargaining unit at that rank. In practice, this seems to work, although we have seen some fireworks when an outspoken Dean was fired — did he still have tenure, something that only applies to members of the faculty unit?
Anyhow, from a salary perspective, the CAUBO data does not capture the management/association divide correctly, and the labeling of “Administration” even with the adjective “Central” can’t dodge this problem. On the ground at every university, faculty complain that there are so many Assistant and Associate Deans, and the salary extras for this work and the Deans’ salaries are part of the perceived administrative bloat. I think you should be wary of this if your future analyses try to say something about admin versus faculty salary growth.
BTW, the argument we hear for the need to have all of these adjectived Deans is that in the unionized settings Chairs can’t take on management roles that they could prior to unionization, and that work has to shift to some other person, as a result.
Herb
You’re quite right about this, Herb. And few institutions are particularly transparent about this kind of data. It’s something I’ll be trying to get at in next week’s blogs.
Herb,
The CAUBO actually does capture the management-association divide correctly. Please reference the cases of Dean Douglas and Lanny Poffo. Faculty may complain about the number of Deans and Associate deans but never complain about the two Undertakers that formed at Survivor Series many years ago.
Hi Alex – I think there may be an error in Figure 1: shouldn’t “Library” be grouped with “Computer & Comms”? And isn’t “External Relations” actually what’s being called “Library” in Figure 1? Just wondering if you have an updated version, if I’m right.
Thanks!
Joanne