


So, last week we talked about growth in non-academic staff; however, due to data limitations, we could only talk about dollars rather than numbers. This is because no one actually collects non-academic staff numbers in Canada, and so most of the data (and anecdotes) around “academic bloat” comes from the US. Last winter, I became sufficiently frustrated with fact-free arguments about “bloated administration” that I devoted part of my holiday to gathering data on this phenomenon. I never quite finished the project back then, but last week gave me the nudge to try to put all of this data on the table.
You might wonder how I did this, given that no one keeps track of data, nationally. Well, individual institutions *do* keep track of these numbers. And some of them even put data up on the web, in things called “factbooks” or “databooks”. And while the data definitions are sufficiently diverse that you can’t really make a national database from this information, it is possible to track changes over time at individual campuses, and then aggregate those changes across institutions. So that’s what I did.
For my sample, I took 25 universities, which collectively comprise about 75% of the national system: the U-15, plus SFU, Victoria, Carleton, York, Ryerson, Guelph, Concordia, UQAM, UNB, and Memorial. Of these, only about half had usable public institutional data on staff. UQAM, Concordia, Laval, and Montreal have very little institutional data online; apparently, Quebec schools don’t seem to think making data public is particularly important. McGill’s website indicates that an institutional factbook containing such data exists; unfortunately, it is password-protected, because obviously the public can’t be trusted with such things (UNB’s data is also password-protected). Dalhousie publishes a little bit of data (mostly about students), and very little else. Queen’s has a “fast facts” page that touches on faculty numbers, but only back to about 2009. Finally, Victoria, Guelph, and Ryerson all publish loads of institutional data online, but nothing on non-academic staff.
That leaves us with 14 institutions. York, Carleton, and Calgary are all officially awesome, and have staff data on their websites going all the way back to 1990. UBC, SFU, Alberta, Saskatchewan, Manitoba, Western, Waterloo, Toronto, and Memorial all have data back to 2000 (though in some cases, a trip to the Wayback Machine is required to get at it all). McMaster and Ottawa at least have data back to 2005.
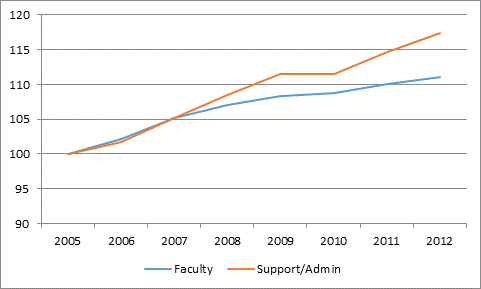
So, what patterns do we see when we look at data from these institutions? Well, if we just look at the national picture from 2005 to 2012 at the 14 institutions (remember: I did this last Christmas – there would probably be another year worth of data available if I did this again), we see that support and admin personnel numbers grew by a little over 17%, compared to a rate of faculty growth of about 11%.
Figure 1: Growth in Support/Admin positions vs Faculty positions, 14 large institutions, 2005-2012
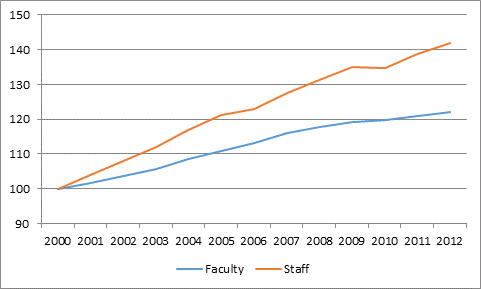
However, if we pull Ottawa and McMaster out of the picture (because their data doesn’t go further back than this) and take the long view, back to 2000, we get a more striking picture. At the 12 institutions where the best data is available, the rate of growth of admin and support staff outstripped academic staff growth by about 16% over twelve years.
Figure 2: Growth in Support/Admin positions vs Faculty positions, 12 large institutions, 2000-2012
We unfortunately cannot tell whether the pattern at our 12 universities is representative of trends across all institutions. But these 12 collectively account for about 36% of the system by enrolments, which is a pretty big sample, so it’s unlikely that full national trends differ too much from this.
But there are more interesting stories to tell once you drill down into the data at a little more depth. Tune in tomorrow.
Intrigued by this data so far? Want to add your institution’s data to this list? Send us a note at info@higheredstrategy.com.


5 Responses
Interesting that the faculty accrual is relatively constant but the staff increases have two flat periods. Can’t be due to new administrative leadership as it’s averaged over 12 universities. The last slow down coincides with the recession but not the one before. Since 2010 the gap has widened – why? Would be good to add the more recent data Alex (next holiday isn’t till Thanksgiving though).
Not sure I’d read too much into that, tbh. I doubt there’s a common cause.
Interesting. Would your approach capture the increase in the number of faculty who are partly administrative, e.g. Associate Deans?
Depends on how they are counted at each university, but in the majority, yes they would (though these are a tiny fraction of overall admin/support staff).
Would be fascinating to redo this analysis for 2025.