


Unfortunately, I’m not here to announce that Canada has overtaken Nigeria or Burkina Faso for the time it takes to release national-level enrolment data (we still lag, sadly). But the only national statistical agency we have has still managed to put out a couple of interesting pieces of interest to higher education over the last few months. Together they make a neat little post.
Let’s start with the Profile of Canadian graduates at the bachelor level belonging to a group designated as a visible minority, 2014 to 2017 cohorts, by Sylvie Brunet and Diane Galarneau. This is a fascinating piece, but also, as I will show in a moment, because it shows all the amazing stuff that StatsCan is capable of producing through new data-matching techniques but is choosing not to.
So, the data first: among other things, the authors show that:
a) students belonging to a group designated as a visible minority made up about 30% of all graduates of Canadian universities between 2014 and 2017– a figure which mostly lines up with previous estimates from the Canadian Undergraduate Survey Consortium which suggested that 25% of incoming students in 2010 and 36% in 2013 were self-identified visible minority.
b) visible minority students as a whole are slightly overrepresented in the graduate population compared to non-visible minorities, but this is not true of all individual ethnicities in the sample (tl;dr Chinese students are significantly over-represented, others much less so).
c) visible minority students – especially those of Chinese origin – are somewhat more likely than non-visible minorities to be enrolled either in business or STEM programs – but this effect appears to be more pronounced among female rather than male students.
d) visible minority students were much less likely to be living apart from their parents than were non-visible minority students.
e) Black, Arab and Latin American students were much more likely to have children of their own than were non-visible minority students or other visible minorities.
Not earth-shattering, but interesting. There is some pretty cool methodology in here, which identifies students’ ethnicities by linking their record-level student data with data from the 2016 census, and their financial status by linking to the T1FF tax file. In fact, it is so interesting that one must ask: why in the hell isn’t StatsCan using this data more regularly and to better effect?
For instance, using exactly this technique, one could report on the ethnic composition of the student body, nationally and by province, annually. This is data we currently do not have, but apparently now it is possible to generate. So why don’t we? Similarly – and MUCH more importantly – the link to the T1FF means that it should be possible to identify incoming students every year and compare their parents income to the incomes of all families with kids aged 18. That would allow us to annually monitor not only the extent to which the student body is economically representative of the population as a whole (nationally and in each province) but also stratification between institutional types and even among fields of study.
Technically, StatsCan has opened a gold mine with these linkage techniques, but they have yet to make these crucial links. The potential for genuinely useful data to drive accountability agendas in higher education is immense, and they are just sitting on it. It’s kind of mind-bending.
Anyways, on to the second piece from StatsCan, which is a data release from a couple of years ago that somehow slipped my notice. Every decade or so, StatsCan asks professors how they use their time. Believe it or not, they do this solely to derive a largely fictious number for international comparison: namely, to derive how much of the national research enterprise is “paid for” by the higher education sector (as opposed to the government sector or the private sector). Basically, this number is calculated by multiplying professors’ salaries by the fraction of the time they claim to spend on research, and you can’t do that without knowing anything about time-allocation, so…
Figure 1 shows average hours per week spent by university professors on four different types of activities: teaching (in-class), teaching (outside the class), research, and service/administration (which includes everything from committee work to reviewing articles for journals. Basically, it shows a profession that works a few more hours per week than other professions, on average, but not inordinately so (46 hours per week). Remember: this is a self-report survey by professors, so if you disagree with what’s shown here, blame your fellow profs (though, to be fair, my guess is that had they split out some categories to include more specific categories on things like “keeping up with the literature”, the numbers probably would have been higher).
Figure 1: Hours per Week, by Task, Full-Time Professors, 2019
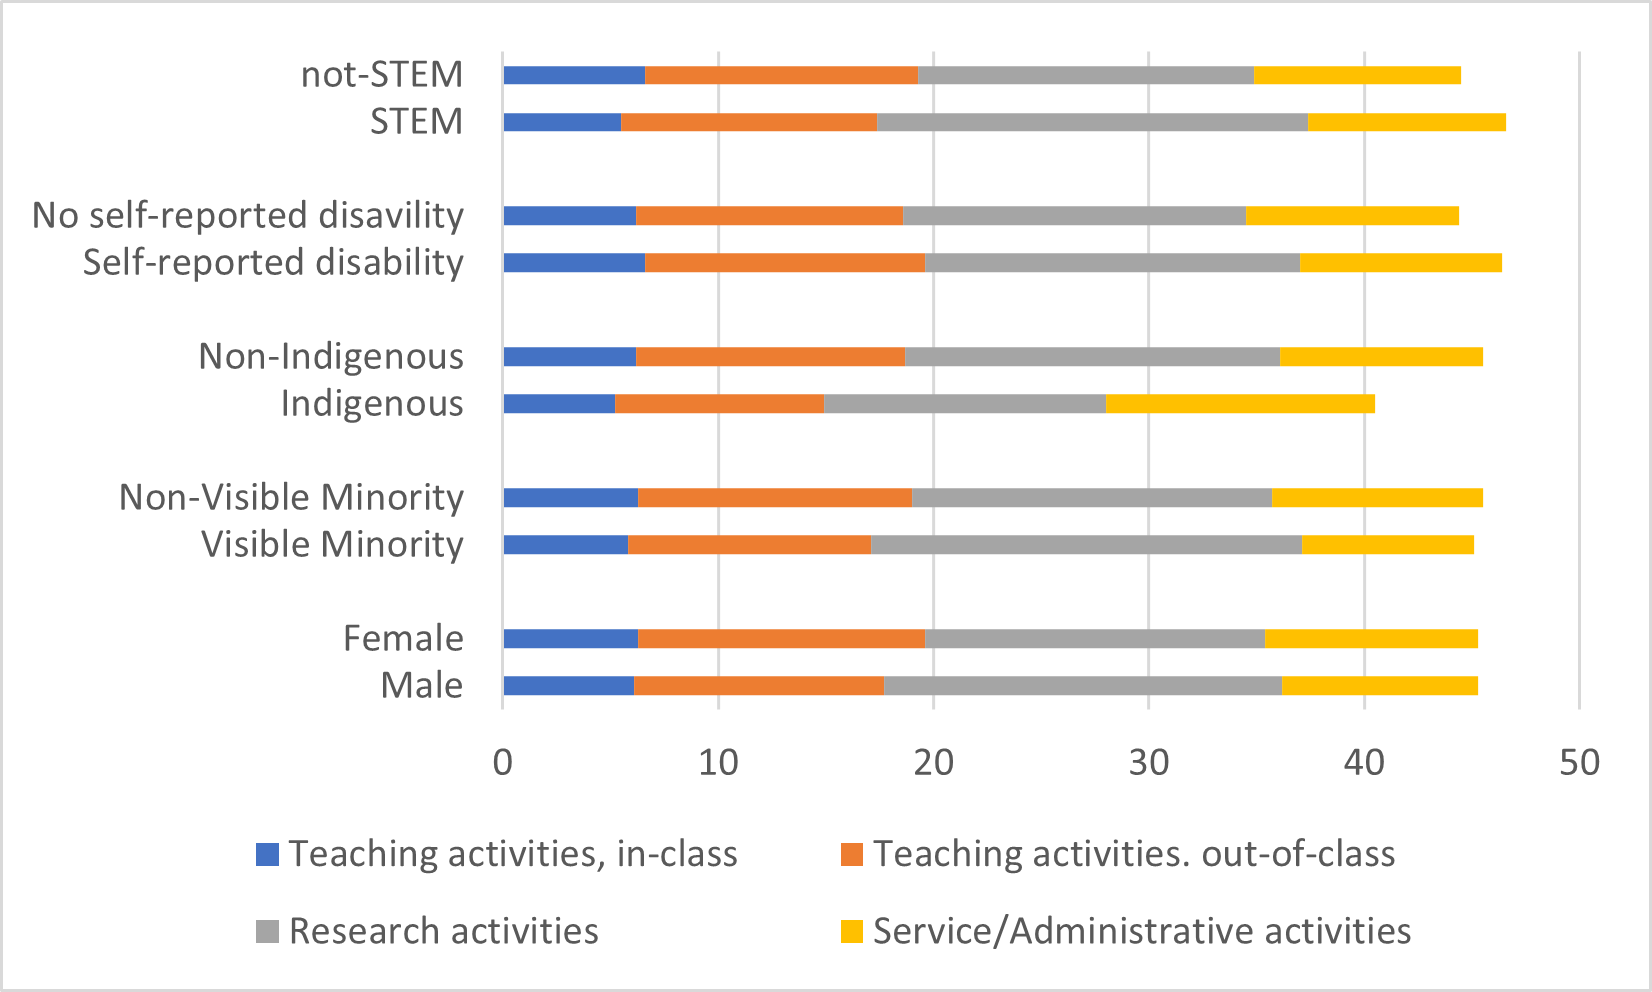
This data shows us that professors work consistent hours across a range of factors. There are not huge differences based on sex, disability, or visible minority status. Even between professors in STEM fields and those not in STEM fields, the difference is only about two hours per week less on teaching and eight hours per week more on research than their colleagues in other fields. The most significant gap listed here is between Indigenous and non-Indigenous profs, but I suspect the difference is at least partially accounted for by not accounting specifically for work in the community.
(There is also data in this release for college teachers, but frankly it is much less interesting: they work about twice the teaching hours as university staff, 20% of the research hours and 60% of the admin hours for, in total, a work week which is about five hours shorter, on average, than that of university instructors).
Anyways, there you have it. A national statistical agency which is by turns utterly infuriating yet technically skilled and occasionally illuminating.

