


Back in the spring, there was widespread panic that postsecondary enrolments – particularly international enrolments – would crumble if students had to spend a whole term online. What do we know about how this has turned out this fall?
Well, in other countries, this is a relatively straightforward question to answer. In the UK, national data on new university acceptances are published right around the time students go back to school. This probably overstates enrolments (not everyone who is accepted enrols), and it tells you nothing about total enrolments (which may be affected by stop-outs or drop-outs) but at least you get a sense of what the dynamics are on a comparable year-to-year basis. And what we find in the UK – where on the whole universities mostly re-opened on a face-to-face basis (only to be subject to emergency lockdowns as COVID swept various campuses) was that new enrolments soared to record highs. Enrolments from within the UK rose 4%, as did new international enrolments.
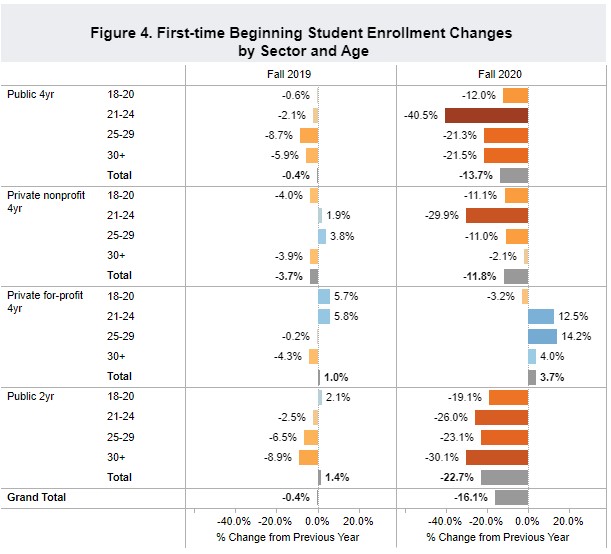
In the US, where the re-opening picture was mixed (roughly half of all campuses are fully or primarily online, with the rest in varying degrees of in-person – see the dashboard at Davidson College’s College Crisis Initiative for a freaking great overview on this), the numbers are much worse. There, institutions voluntarily provide data to a non-profit organization known as the National Student Clearinghouse, which means you can good and reasonably representative national data as early as mid-October. This year’s results are here and they are not good. Overall, undergraduate enrolments are down 4%, but new enrolments are down 16%, and 22% at community colleges (but up 4% at for-profit 4-year institutions).
Now, what about Canada? Well, of course, no one reports numbers like this because, say it together, “Canadians do not care about access or data, but especially don’t care about data on access.” We might get Statscan data on what happened this fall sometime in late 2022, if we’re lucky. Other than that, what we get are individual press releases from institution which are almost invariably partial and designed to portray a “good news” story. So if an institution loses 1000 international students paying $25K per head but gains 1100 part-time students paying $1000 each, this is trumpeted as a “gain of 100 students” (which is true but not very helpful, if you are looking for evidence of financial sustainability). Eventually, we’ll get some kind of national picture via the annual Universities Canada survey, but that only shows total enrolments (but not new enrolments, which, as the US data shows, is more volatile) and provides no data on international students, which is the bit everyone wants to know about. My fellow higher-ed pundit Ken Steele is keeping track of these announcements (the date on this piece is early September, but the Google sheet seems to have been updated since then). Mostly what it seems to show is that universities are doing better than colleges, and that most schools are mighty cagey about what their international numbers look like.
There is, though, one glorious exception to Canada’s data obscurantism, and that is the Atlantic Association of Universities (AAU) which publishes good, comparable, detailed information about enrolments – domestic and international, total and new – every October. And last Friday AAU came out with its 2020 data. It is…interesting.
Region-wide, what the data tells us is this:
- Full-time enrolment is down slightly (1.1% undergraduate, 3% graduate, 1.3% total).
- Part-time enrolment is up sharply (19.6%), albeit from a low base.
- Visa-Student Numbers are down 6.6%, but it’s very unevenly distributed. Cape Breton, Ste. Anne, NSCAD and Acadia all saw double-digit declines, but some institutions – notably Dalhousie –saw slight increases.
- Full-time first-year enrolments are down fairly sharply (10.5%), again, with big drops at NSCAD and Cape Breton but also Mt. St. Vincent.
- But overall, total enrolments are up 1.6%
This is a mixed bag. It’s not good, but it’s not terrible. It’s behind last year, but well ahead of the worst-case scenarios. Dalhousie, for instance, was budgeting for a $40 million decline in tuition fees; my back-of-the-envelope calculation based on this data is that they might not be out much more than a million. Cape Breton is certainly in a bit of a pickle – they might be losing $16 million in revenue this year, but since it ran a $23 million surplus last year, that’s probably not the end of world. For now, anyway.
But overall, the data says that the effects of COVID are highly variable. Larger institutions, more prestigious institutions, appear likely to get through this crisis with fairly little damage. Smaller institutions, less prestigious institutions though: they’re a different story. We’ll need to wait for more fulsome data, but there is certainly some cause for concern.


One Response
Bear in mind that Cape Breton also staked a great deal on foreign student enrollments. The lesson might not be that they lack prestige, but that they bet on the wrong horse.