


We have almost come to the end of the nutshell series. In this, the final installment, we will look at Saskatchewan, which when you think of it is kind of to the other provinces what Canada is to the rest of the world. The quintessence of Canada, if you will.
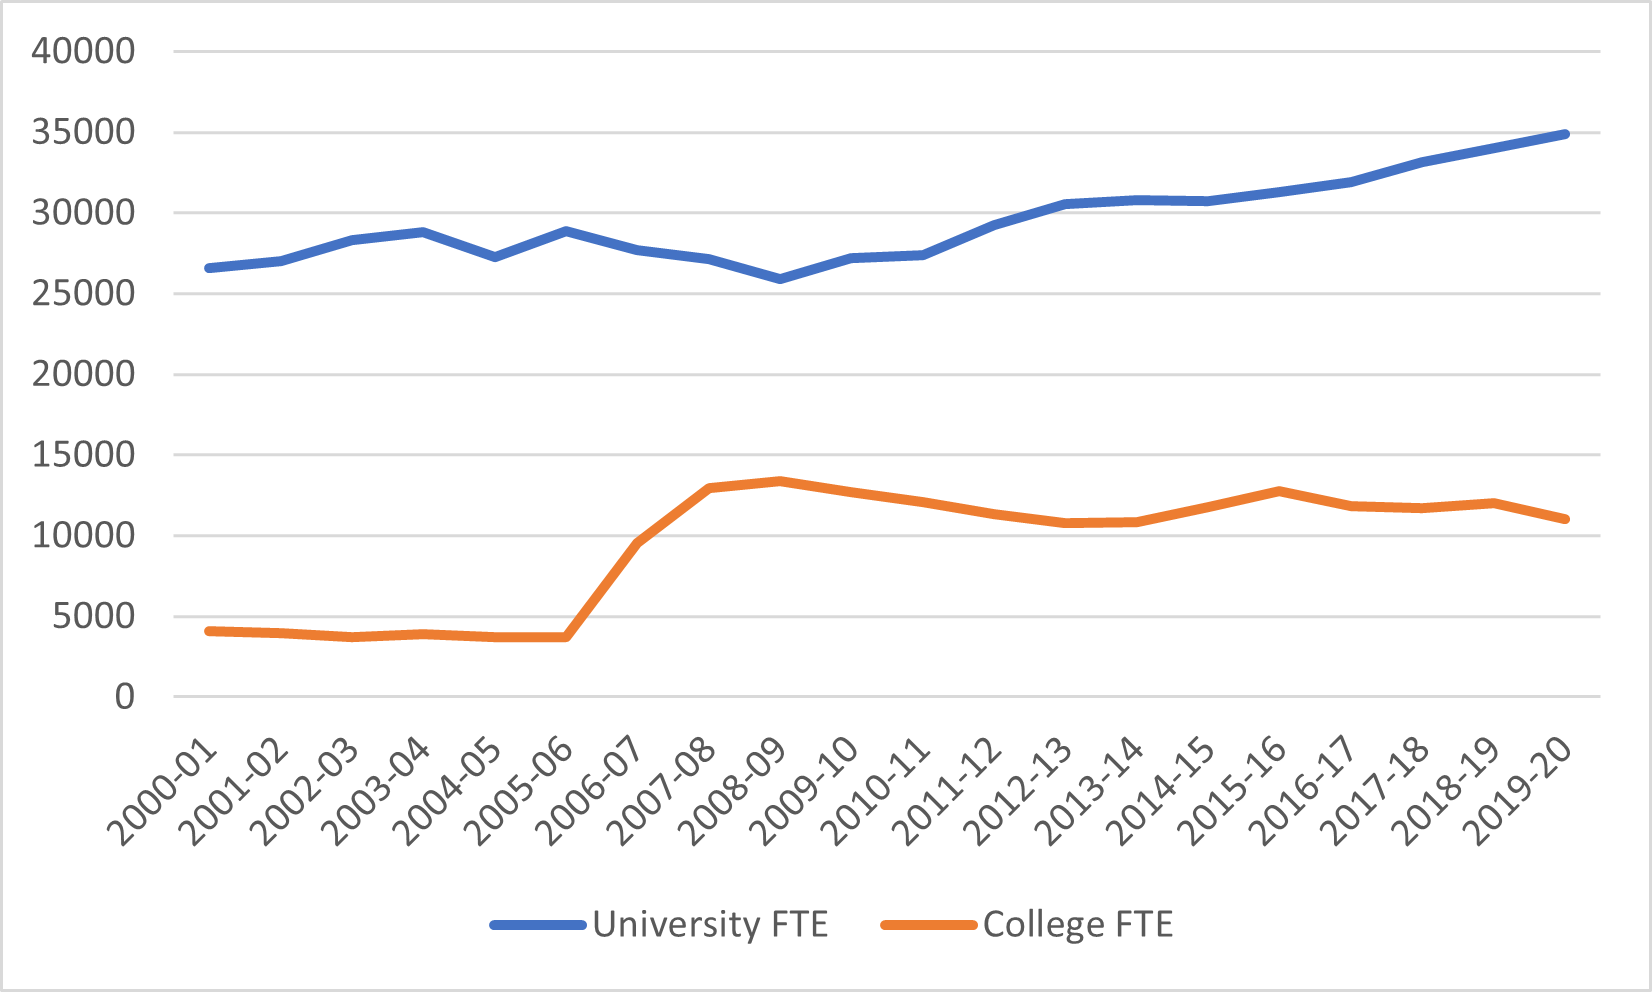
Taking Saskatchewan last is partly a function of data problems in the province. As in several other provinces, college numbers are subject to a sudden surge in the late aughts, not because enrolments themselves changed but because of a reclassification of certain vocational programs. In addition, at around the same time the University of Regina chose to cease submitting to Statistics Canada (a tiff about data use), so the data in figure 1 is reconstructed by University of Regina data (U of R being above average for mid-sized universities in terms of the amount of data it makes public). In any case: university enrolments have been increasing slowly but steadily since 2009, while college enrolments have been decreasing slightly.
Figure 1: Full-time Equivalent Students, by Sector, 2000-01 to 2019-20
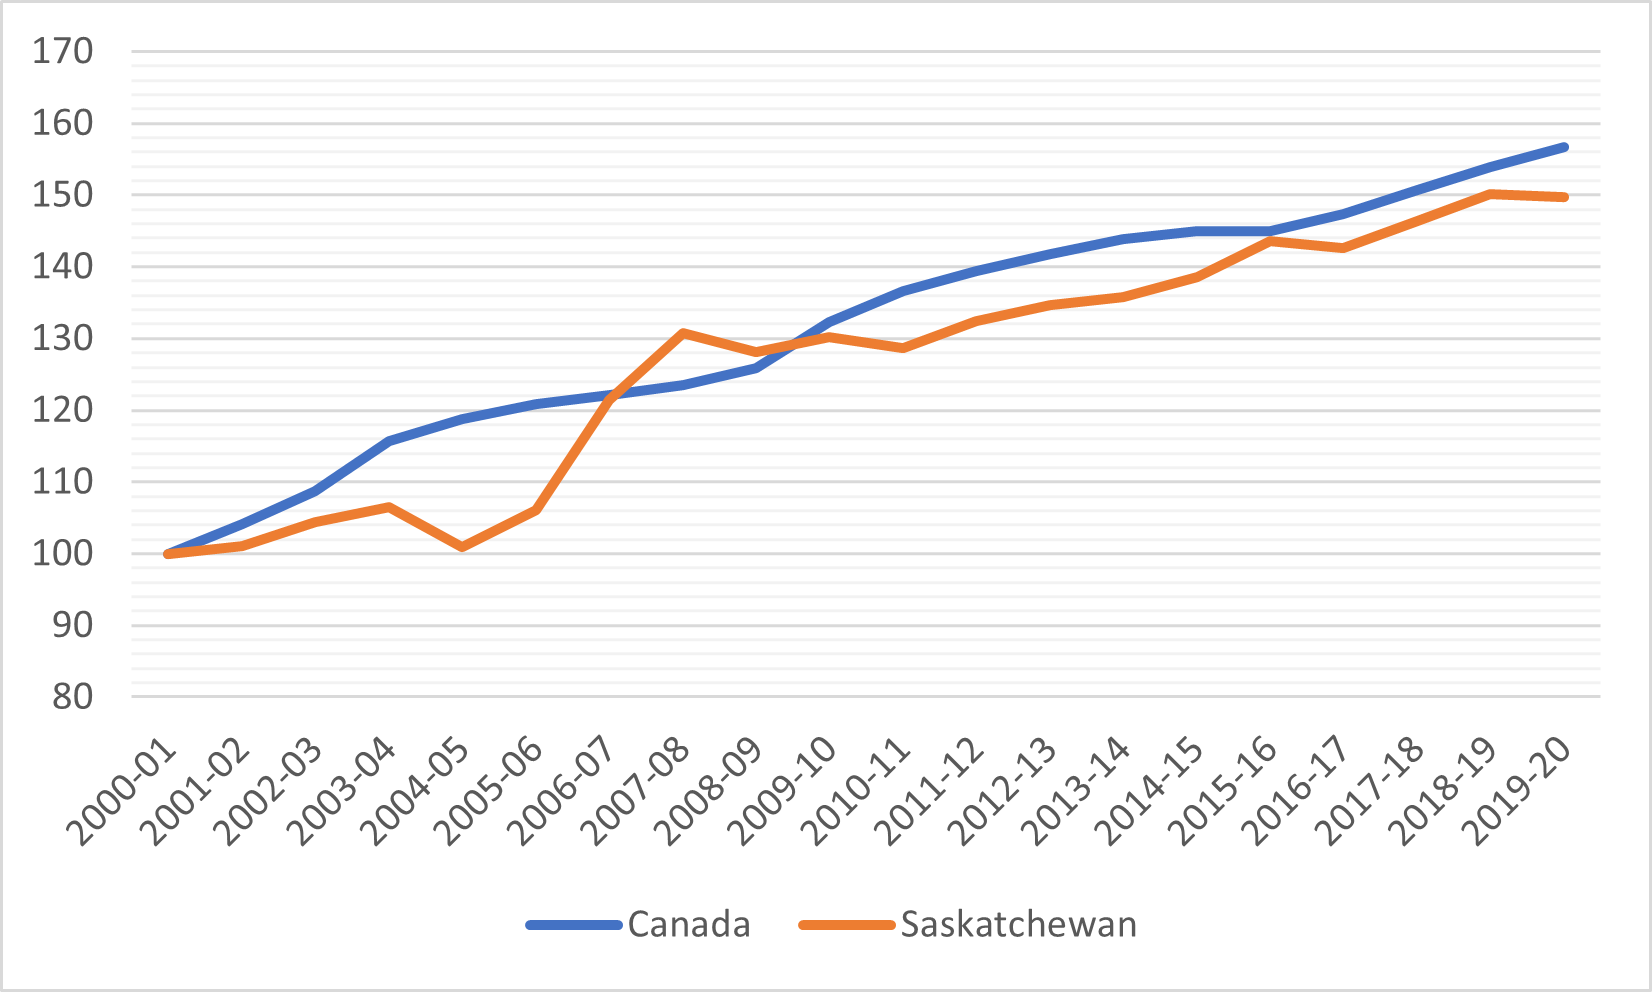
The overall data (see figure 2) indicates overall Saskatchewan FTE enrolments have been increasing at a rate similar to the rest of the country. However, it is worth recalling that half of the total increase in recorded Saskatchewan enrolments are due to the statistical reclassification of vocational students in 2006-7, meaning that in actual fact enrolment growth in the province has trailed that in the rest of the country.
Figure 2: Indexed Full-Time Equivalent Post-Secondary Students, Saskatchewan vs Other 9 Provinces, 2000-01 to 2019-20 (2000-01 = 100)
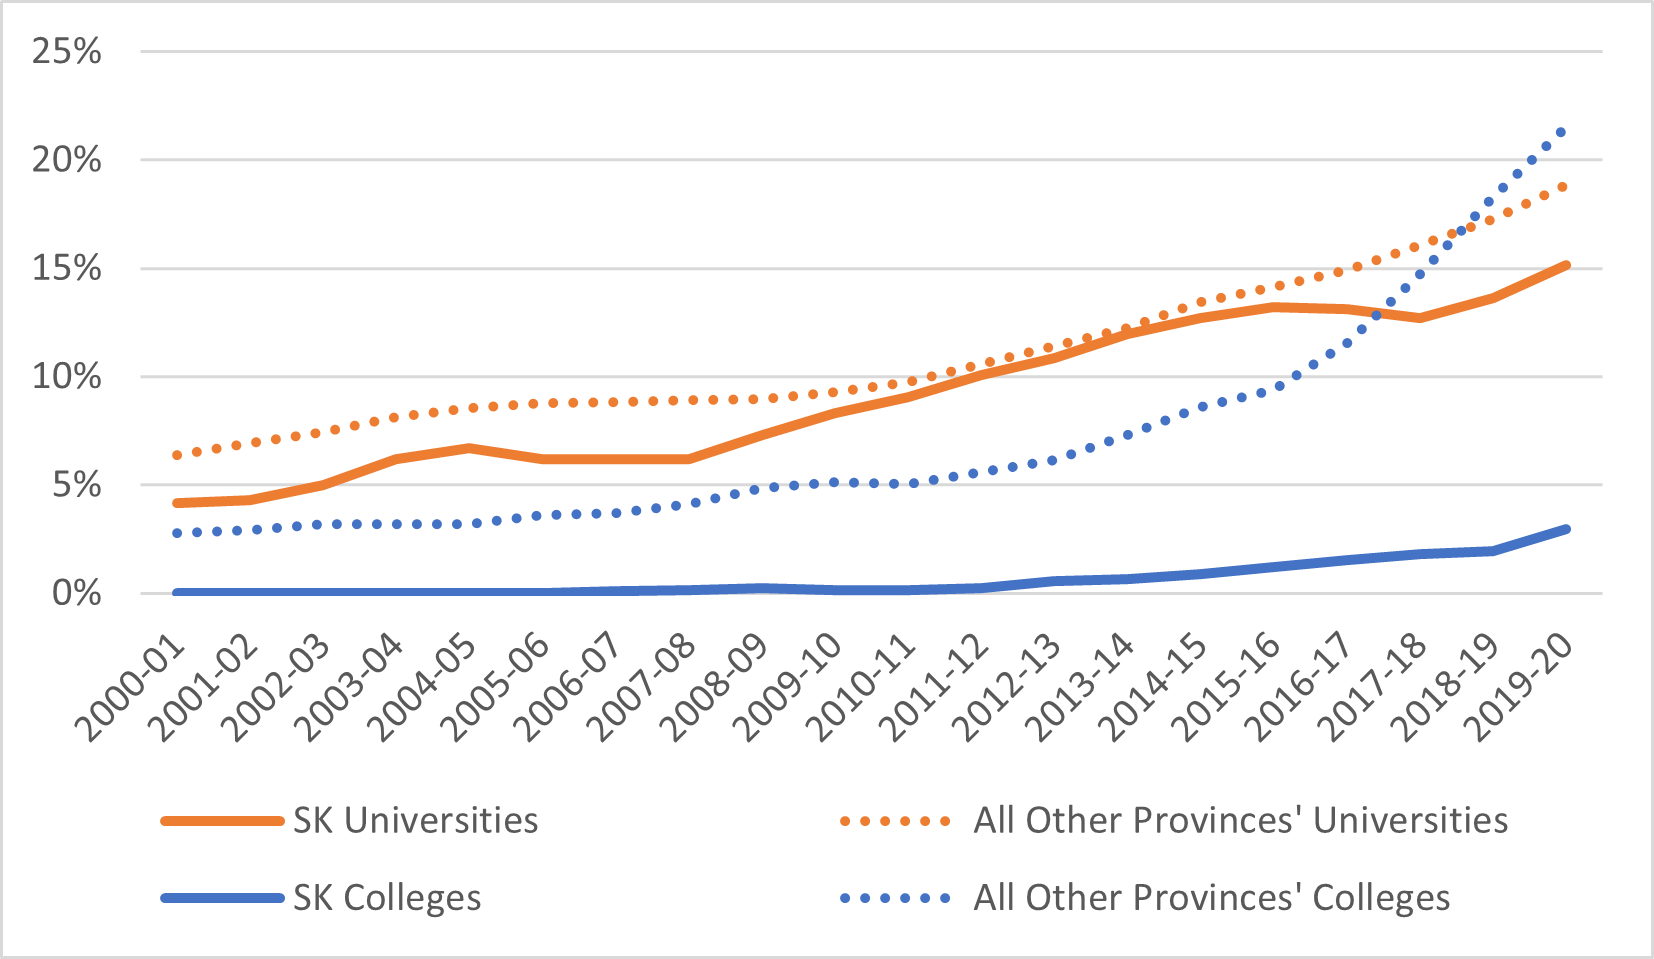
Saskatchewan institutions are less reliant on international students than those in other provinces. On the university side, international students make up about 15% of total enrolments, compared to about 18% in the rest of the country. But it is at the college level that we see the bigger gap: 3% in Saskatchewan versus over 20% in the country as a whole. Conceivably, this means that Saskatchewan Polytechnic has some considerable room to increase its overseas enrolment.
Figure 3: Proportion of Students from Outside Canada, by Sector, Saskatchewan vs other 9 provinces, 2000-01 to 2019-20 (2000-01 = 100)
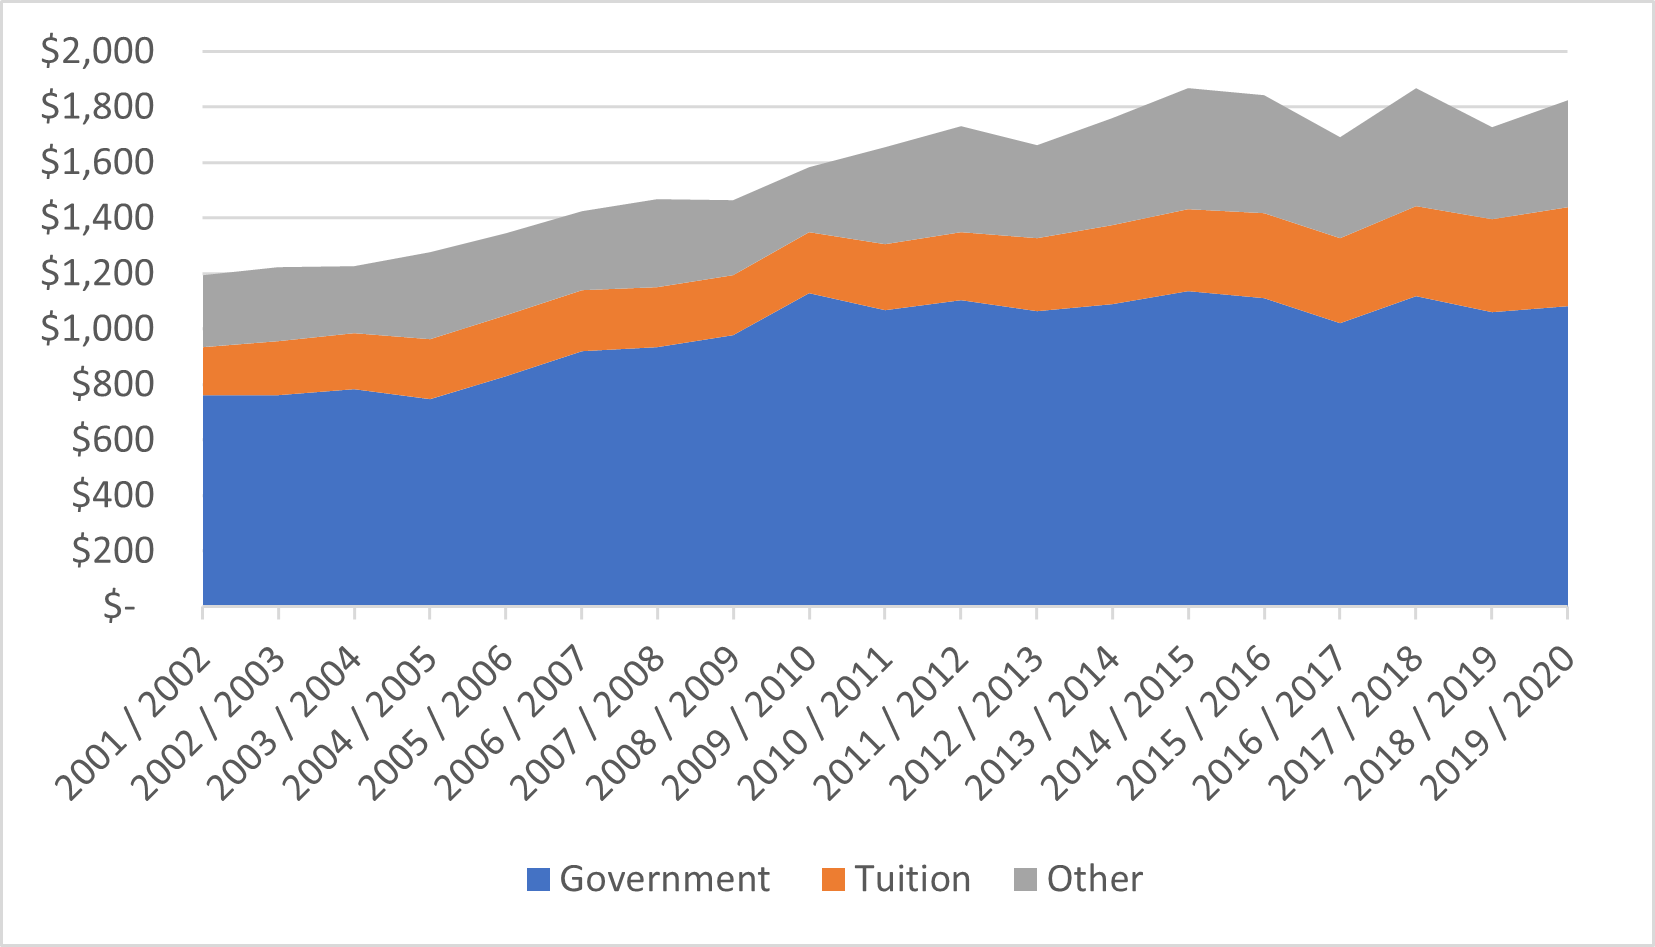
With respect to institutional funding, Saskatchewan looks fairly similar to the rest of the country in the sense that government funding increased in the aughts and plateaued in the ‘10s. It is also similar in the sense that student fees have become a more important source of income.
Figure 4: Total PSE Institutional Revenue by Source, Saskatchewan, 2000-01 to 2019-20, in millions of constant $2019
However, as figure 5 shows, the increase in tuition income trails the national average substantially. This is not because of domestic tuition; in fact, as figure 6 shows, this has been increasing faster than the national average over the past twenty years. Rather, it is because Saskatchewan institutions have chosen not to raise funds through attracting international students in the way that certain other provinces have.
Figure 5: Indexed Change in Institutional Income from Governments and Tuition Fees, Saskatchewan v. Other 9 Provinces, 2000-01 to 2019-2020 (2000-01 = 100)
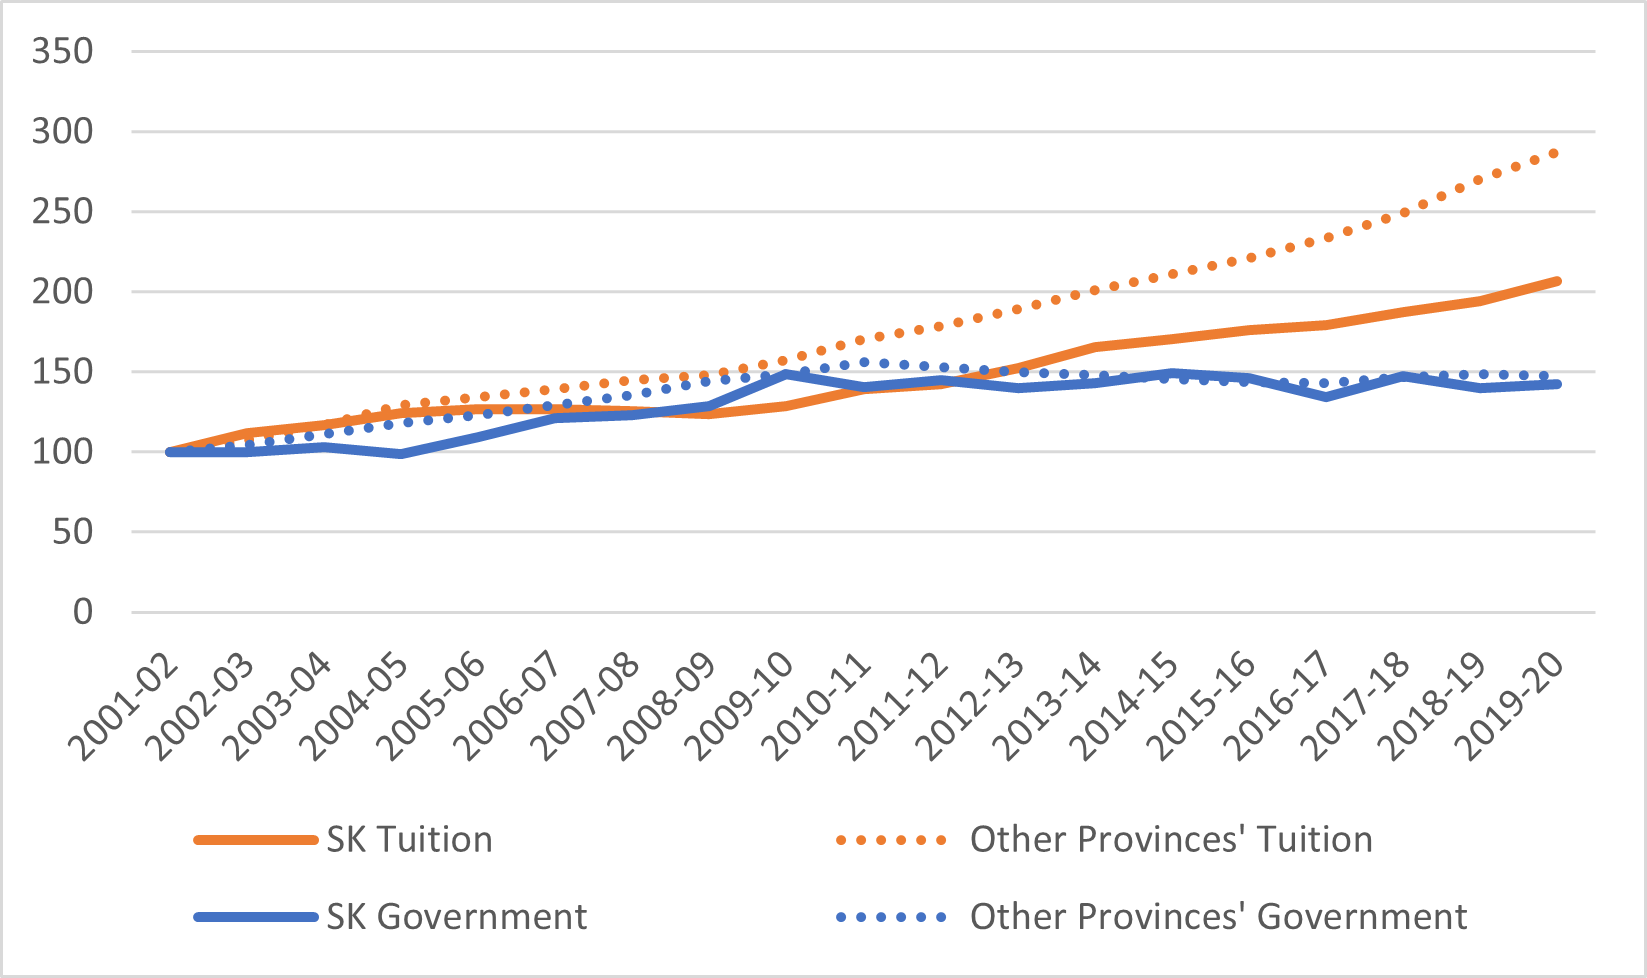
Figure 6: Tuition Fees, Saskatchewan v. Canada, 2006-07 to 2021-22 (in constant $2021)
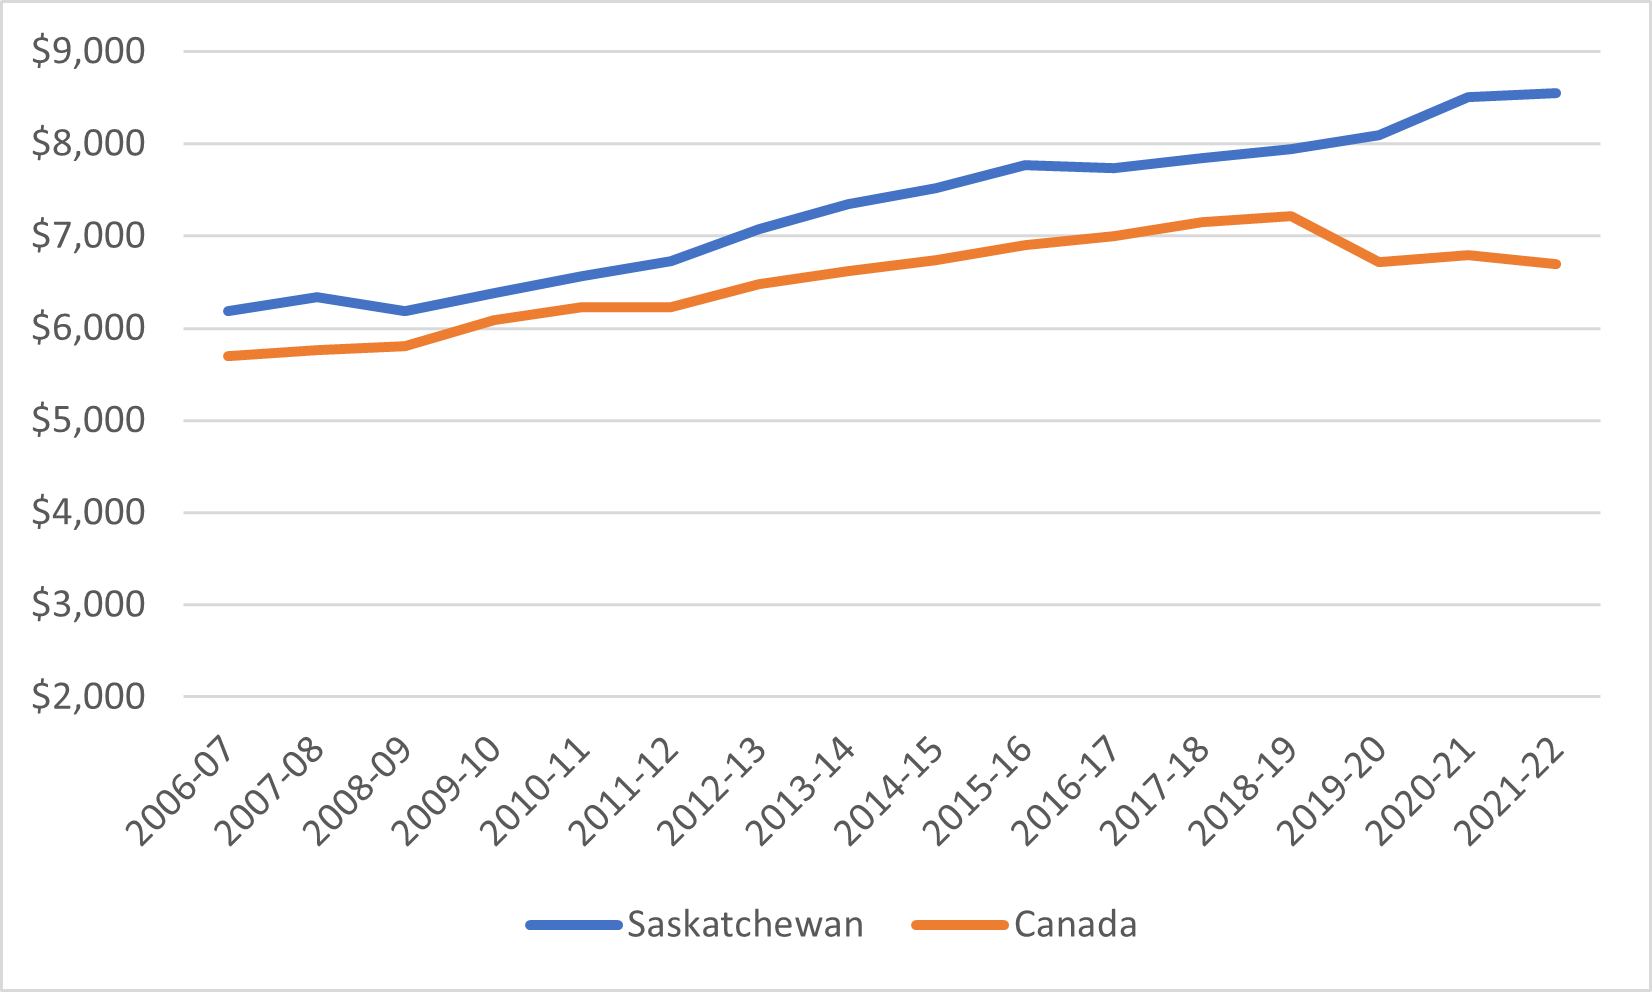
Figure 7 shows the average loan per recipient plus average grant per recipient over time in Saskatchewan, from both federal and provincial sources (this is not quite the same thing as an average aid package because not all loan recipients are also grant recipients). According to this information, the total size of combined federal-provincial aid packages stayed roughly constant through to about 2017 at just under $8,000 in loans per year and just over $2,000 in grants. However, after 2017 the loan portion of the aid package became somewhat larger. mainly it seems because of changes to reporting requirements on spousal and pre-study income.
Figure 7: Average Loan Plus Average Grant Disbursed, Saskatchewan, 2011-12 to 2019-20, in constant $2019

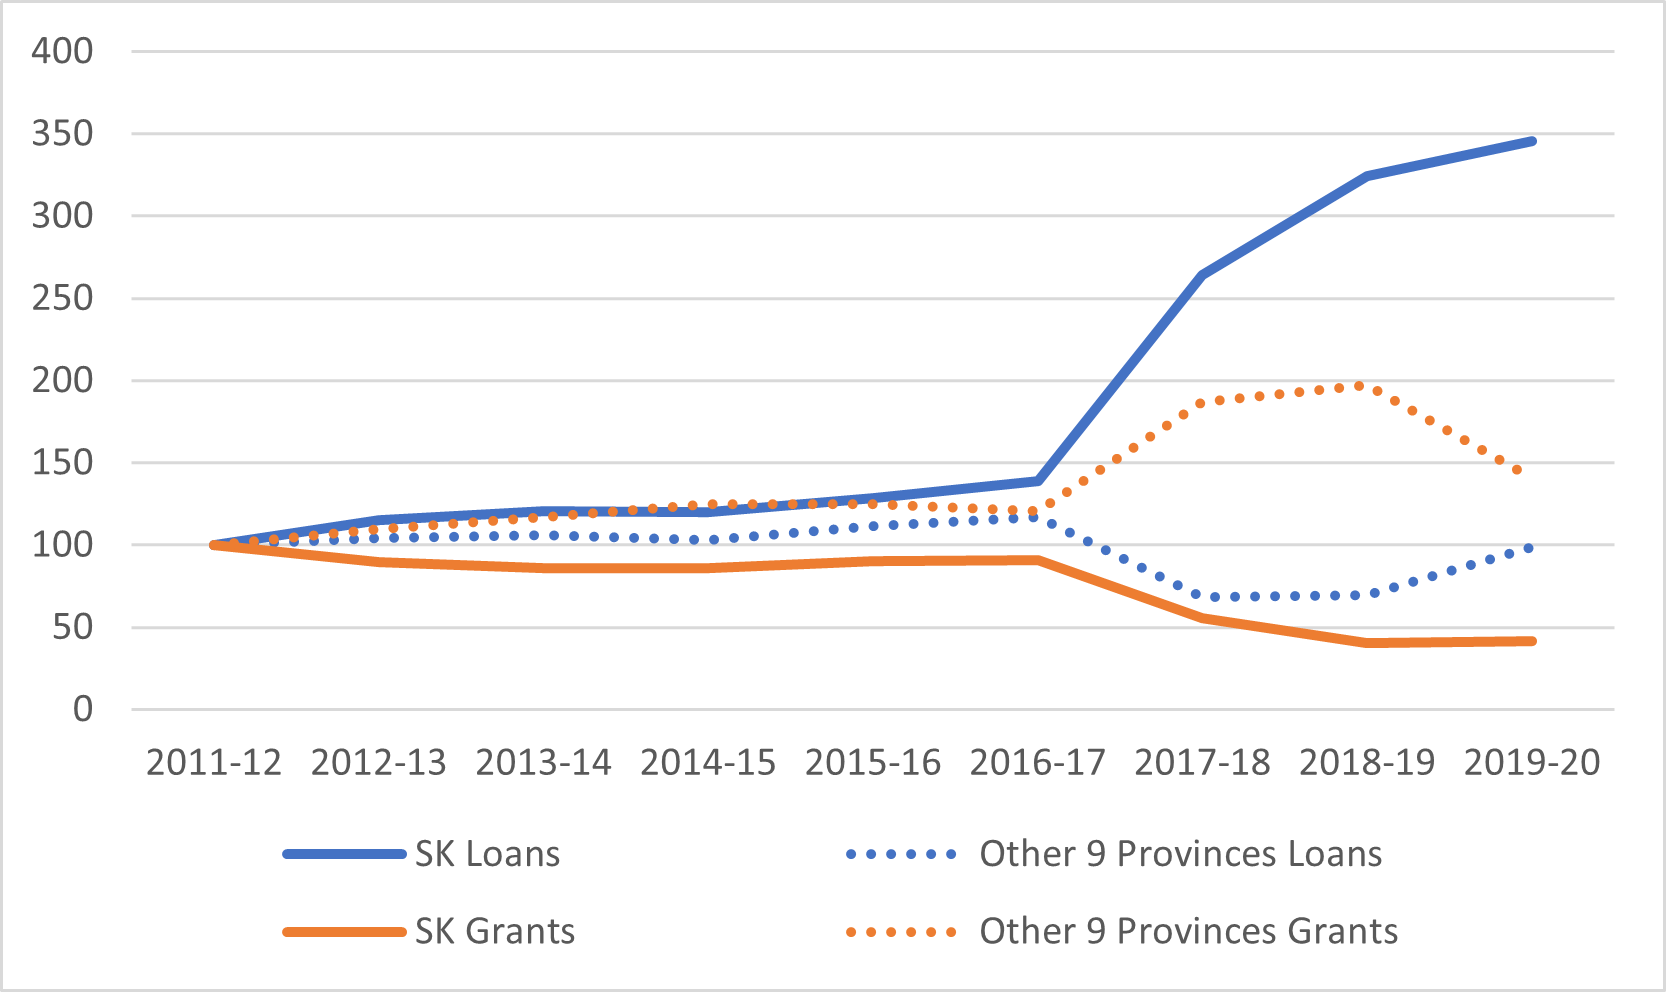
Figure 8 shows the change in distribution of provincial loans and grants (i.e. excluding Canada Student Loans) since 2011-12. What it shows is that loans issued increased substantially after 2017. Grants decreased at the same time, albeit for a different reason. Saskatchewan was among the most generous provinces with respect to grants prior to that date. In 2016-17 the federal government increased its grant awards substantially, which allowed the province to reduce its own contribution to grants without affecting the total amount available to students (that is to say that federal grants simply displaced provincial ones).
Figure 8: Indexed Change in Total Real Provincial Loans and Grants Disbursed, Saskatchewan vs. Other 9 Provinces, 2011-12 to 2019-20 (2011-12 = 100)
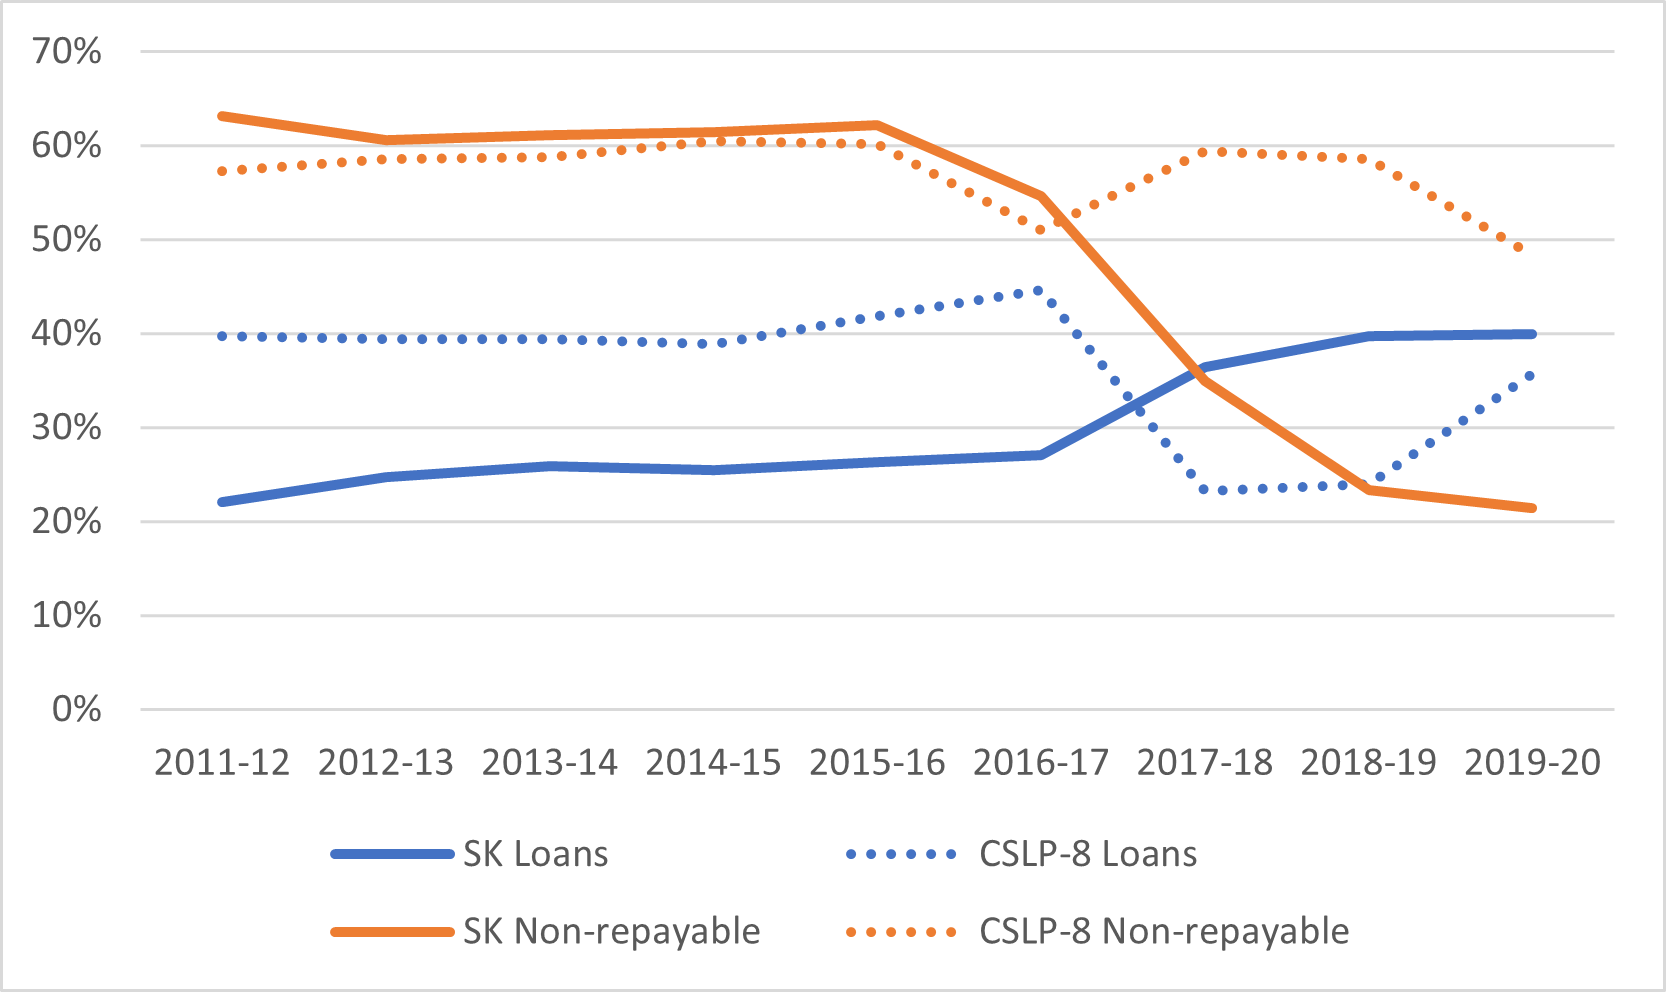
This process of displacement is more easily seen in Figure 9. which examine how much of the province’s student assistance comes from provincial as opposed to federal sources. For this exercise, we compare Saskatchewan to just the other eight provinces which participate in the Canada Student Financial Assistance Program. For much of the period under examination, Saskatchewan provided about 60% of all non-repayable aid in the province, close to the national average. Then, suddenly, in 2016-17 the percentage plunged to just 20% as federal aid came to pick up the slack (total non-repayable aid in Saskatchewan actually increased in these years as federal grants increased nearly threefold). Meanwhile, the provincial portion of loans issued rose from 25% to 40% of all loans.
Figure 9: Provincially-Funded Loans and Grants Disbursed as a Percentage of Total Loans and Grants Disbursed, Saskatchewan vs. 8 other Canada Student Loans Program Provinces, 2011-12
So that’s it for the “nutshell” series. We hope you have enjoyed them; maybe we’ll do it again in a few years.


2 Responses
I question the validity of the data presented on international student enrolment at Saskatchewan Polytechnic. Are you referencing all eight regional colleges and Saskatchewan Polytechnic, or just Saskatchewan Polytechnic? Sask Polytech has seen a steady growth in international students over the last few years and our preliminary Fall ’22 international student enrolment data indicates that we will be close to 15% of total enrolment.
Hi Thevi.
My understanding of the way Statscan defines colleges is that this is Saskpoly only, but it’s possible this includes learners at regional colleges taking Saskpoly courses. In any case, it;s based on what institutions in Saskatchewan are telling Statscan.
Saskpoly may well have had significant growth in enrolment in recent years, but keep in mind the data here is only current to 2019-20. Success since that time won;t be in the data yet.