


People often want to compare jurisdictional efforts with respect to postsecondary education investments. These are typically exercises in choosing denominators: the numerator (total spending) is constant, it’s just a question of how to normalize raw expenditures.
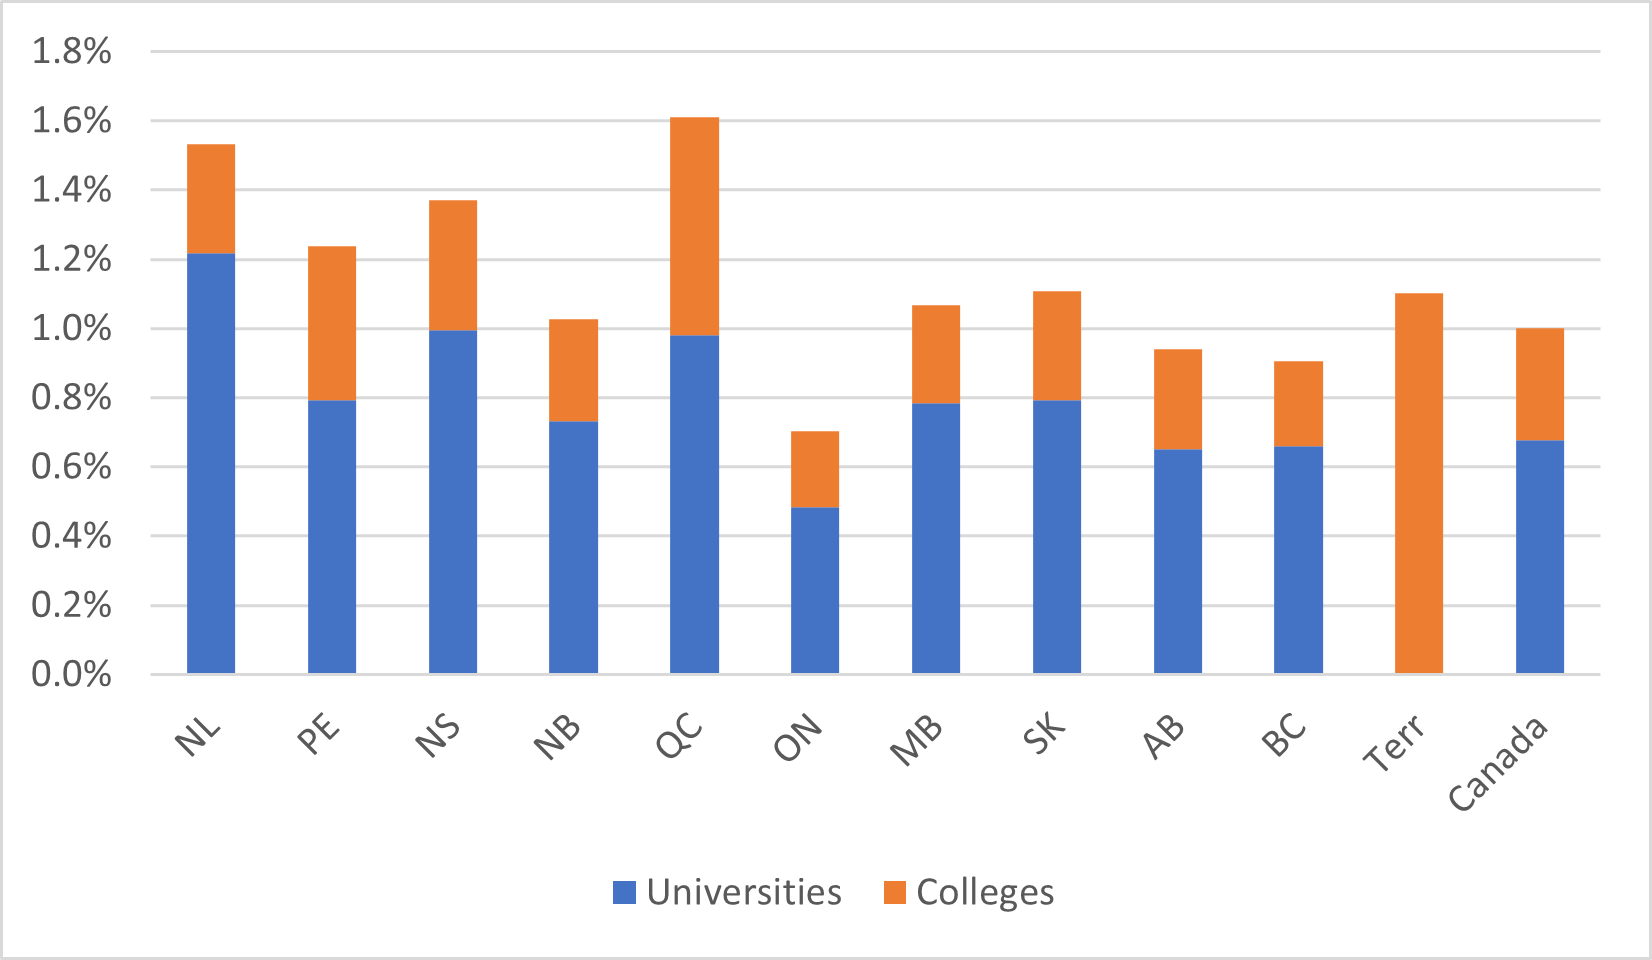
In Canada, we tend to normalize expenditures in one of two ways: either in per student terms, or in terms of gross domestic product. Figures 1 and 2 show these two measures across Canada. In short, Newfoundland and Labrador and Saskatchewan look the best if you examine on a per-student basis, but on a per-GDP basis Quebec looks much better and Saskatchewan looks much more ordinary. Ontario looks terrible on both measures.
Figure 1: Government Transfers to Institutions per FTE student, by Province and Sector, 2020
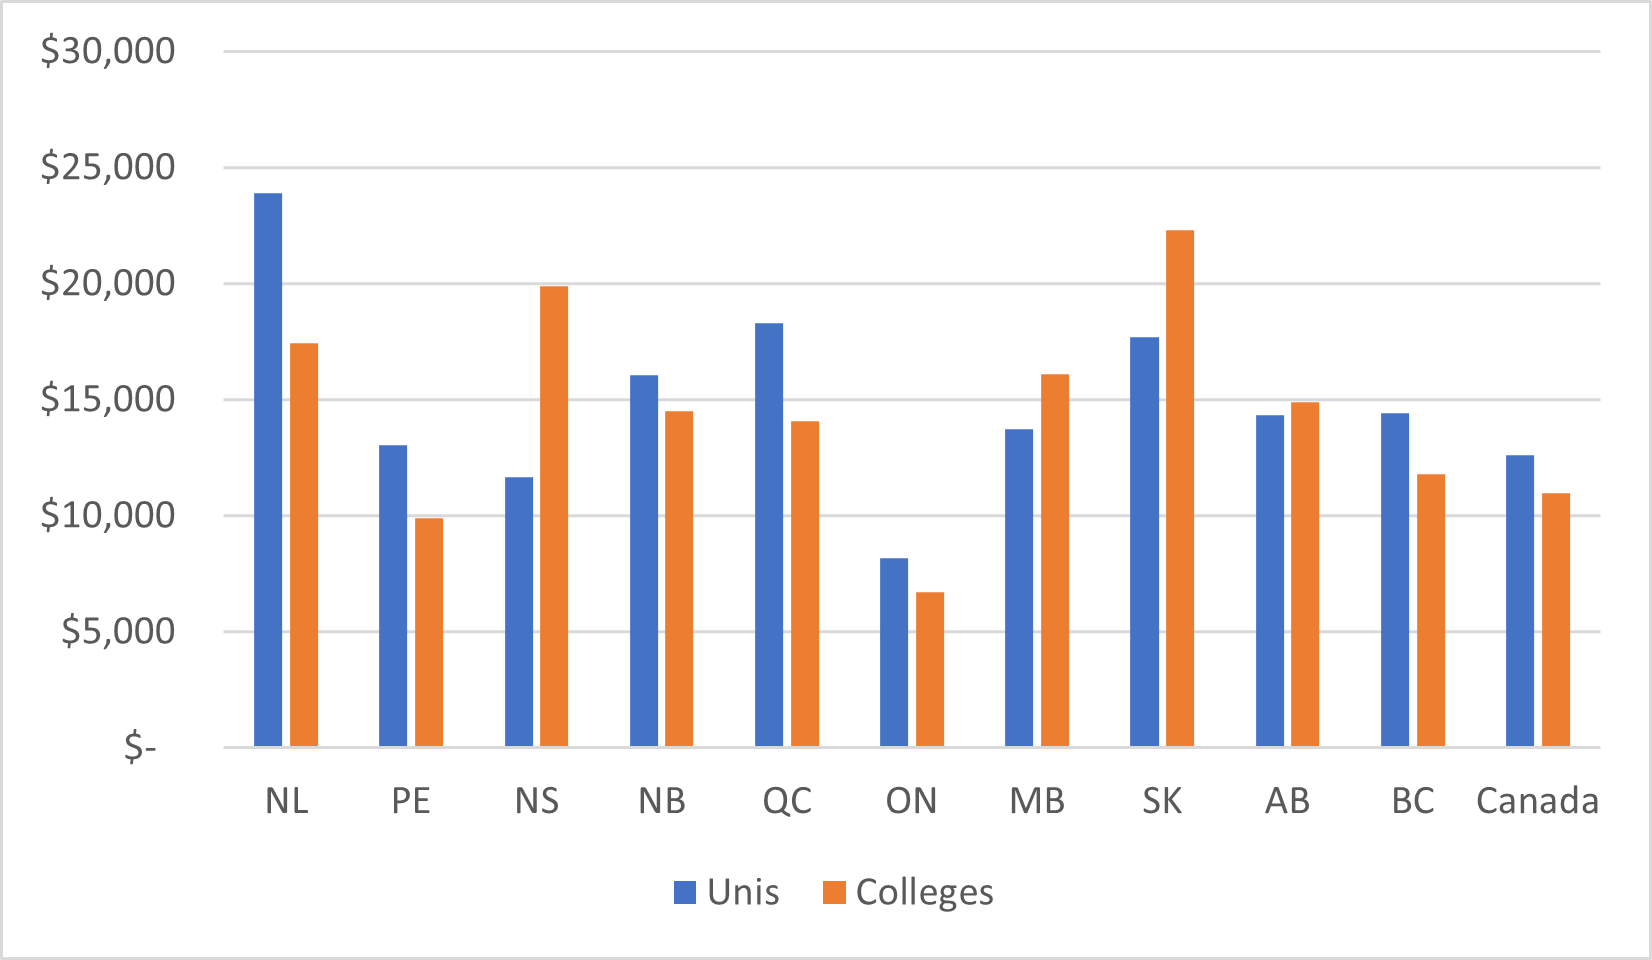
Figure 2: Government Transfers to Institutions as a % of Gross Domestic Product, by Province and Sector, 2020
But other countries have different ways of examining effort. One metric, often used in the United States, is public higher education expenditures as a percentage of total current government expenditures. It measures – independently of student numbers and jurisdictional economic size – the extent to which each jurisdiction prioritizes higher education relative to other areas of its own current expenditure (that is, net of capital expenses, debt payments, etc). We find quite an extraordinary gap between states. At the top end, (mainly Republican) states in the west like Utah and Texas put over 10% of total government expenditures into higher education, whereas (mainly Democratic) states in the Northeast such as New York, Massachusetts, Rhode Island and New Hampshire are all below 4%.
Figure 3: State Government Expenditures on Postsecondary, by Percentage of Total Expenditure
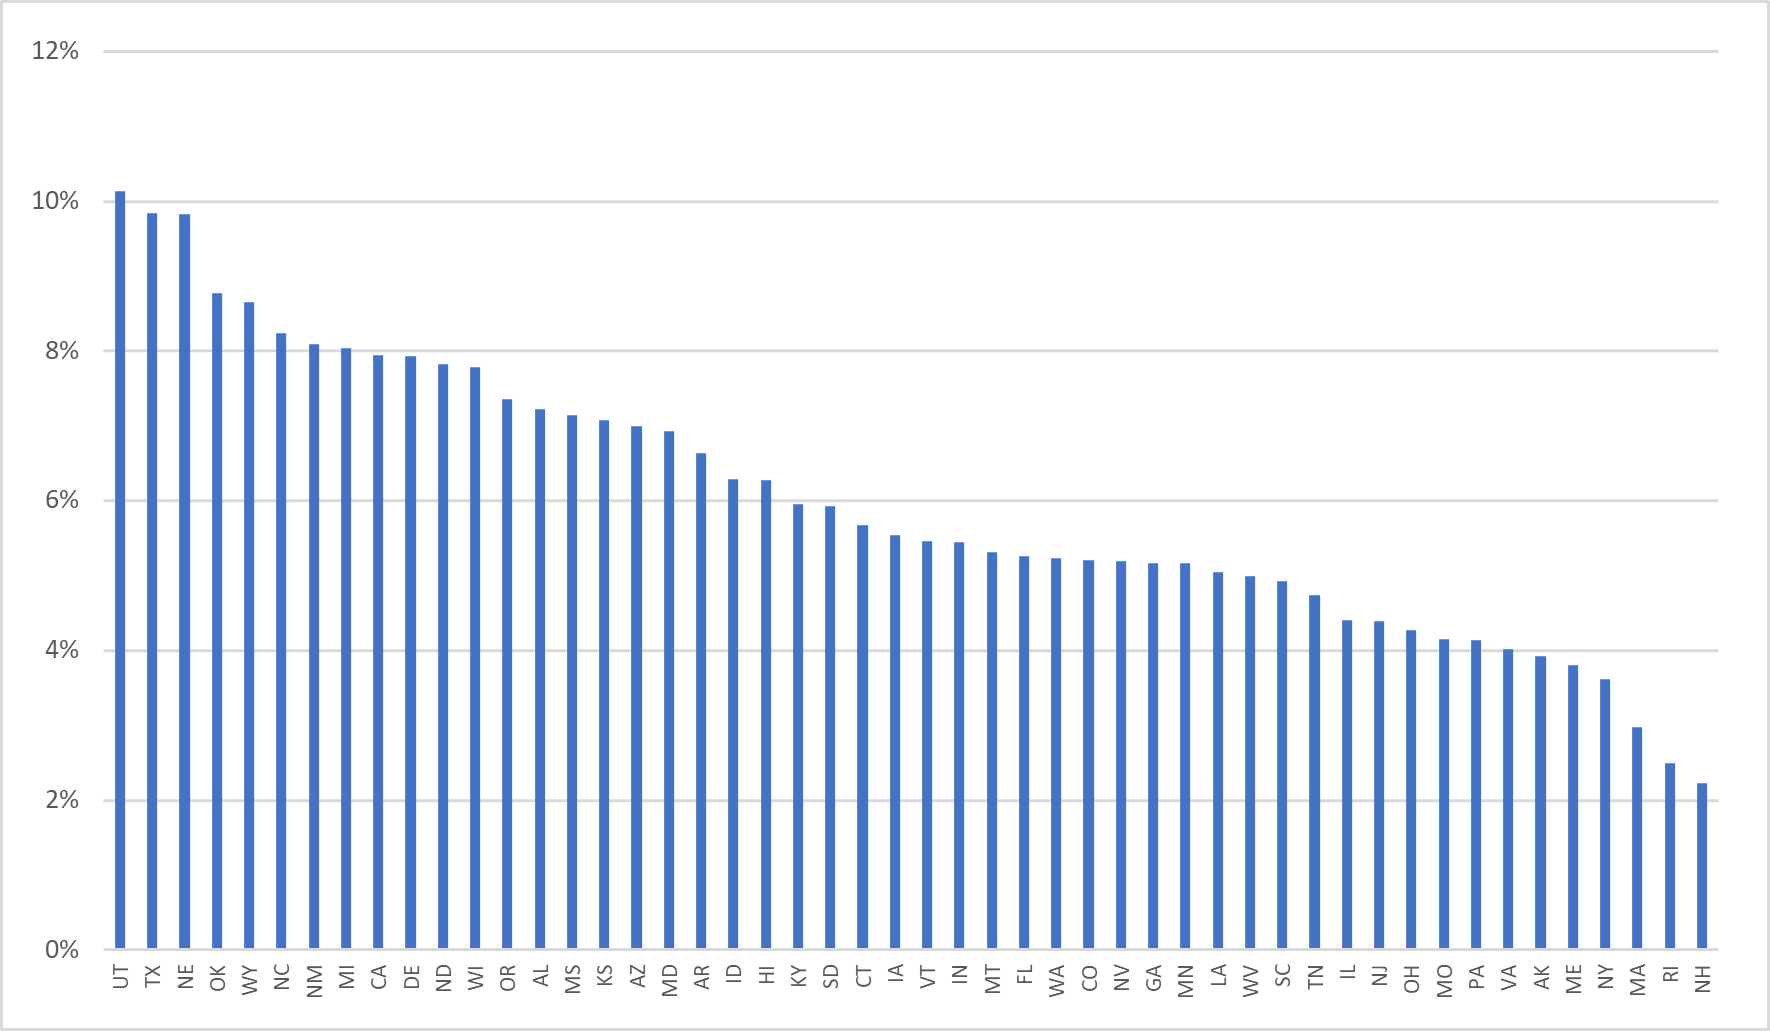
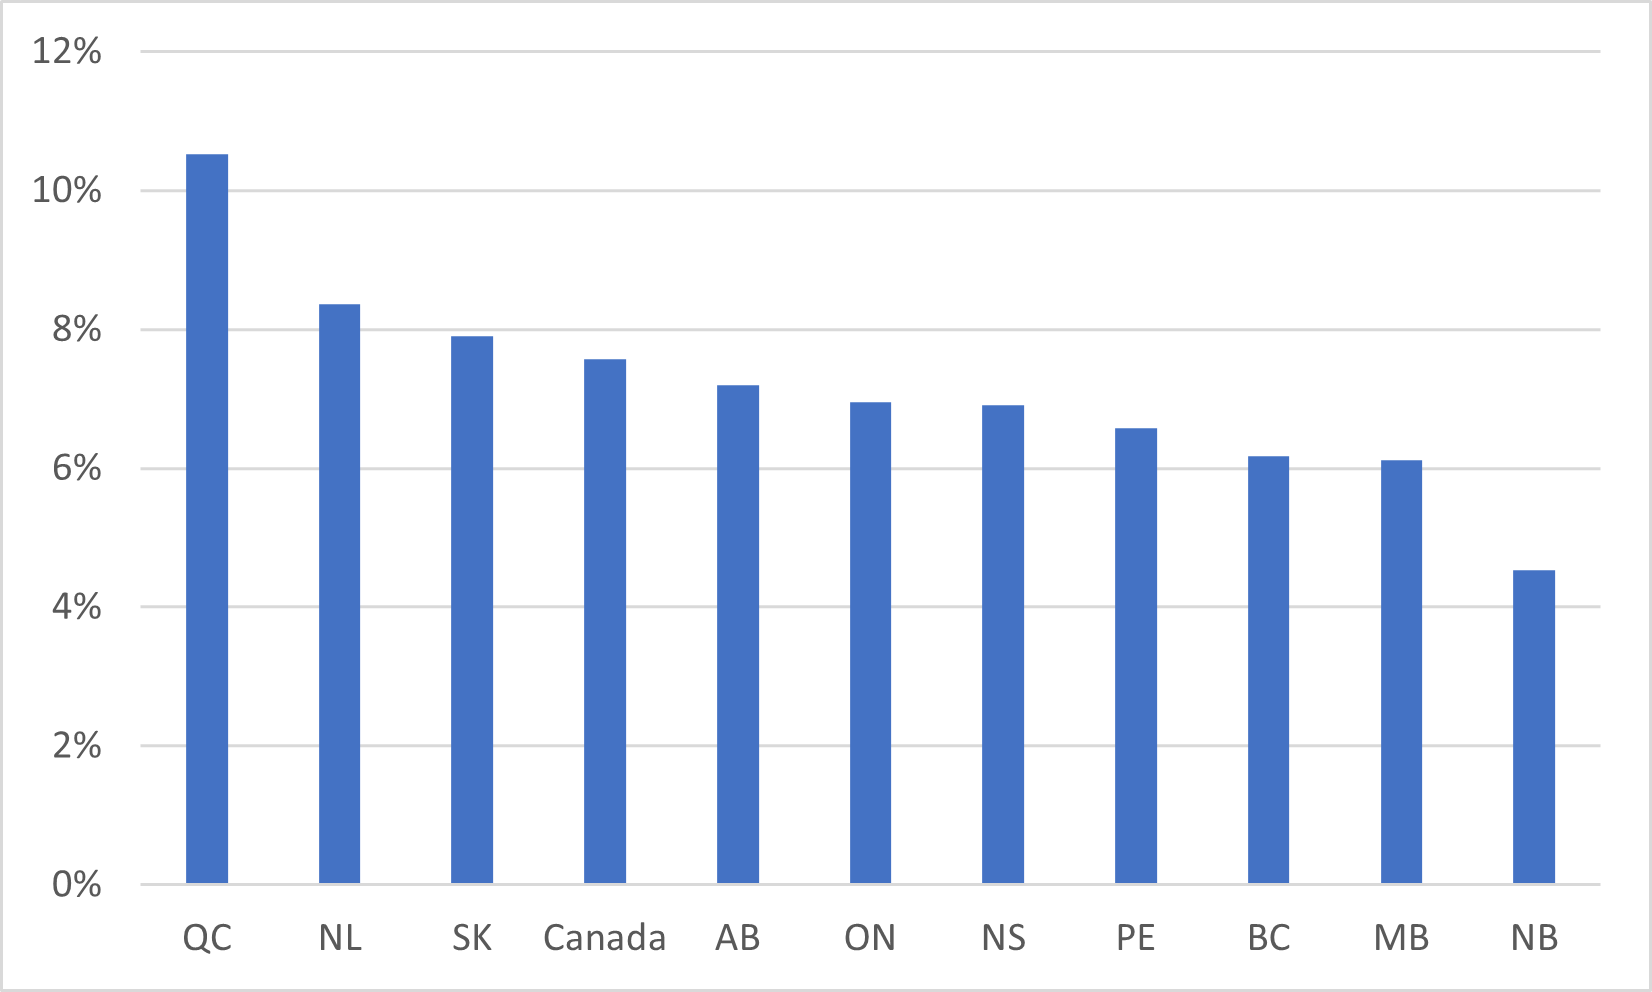
Figure 4 shows how this plays out in Canada. To make the Canadian data compatible with that of the US, I have added provincial expenditures on student assistance to total transfers to institutions, which adds about a little more than 10% to total expenditures. What it shows, first of all, the spread between the top-spending (Quebec) and he bottom-spending (New Brunswick) is somewhat smaller than it is in the US, even though the difference in national averages is not all that large (8.2% in Canada vs 6.6% in the US). Secondly, consistent with Figures 1 and 2, Quebec comes head of the class with respect to postsecondary expenditures as a proportion of government expenditures, with Newfoundland and Labrador and Saskatchewan coming not far behind in second and third. However, Ontario looks significantly better than it usually does, partly because of the addition of student aid but also because of the change of denominator. Instead, it is New Brunswick which ends up at the bottom of the class, and it’s not even particularly close.
Figure 4: Provincial Government Expenditures on Postsecondary, by Percentage of Total Expenditure
(I should stop here to note that at least part of the reason that expenditures in Quebec look quite high compared to other provinces is that it includes what other provinces consider grade 12. If you take off, say, 50% of CEGEP expenditures to correct for this, Quebec would still be first, but the gap with Newfoundland would disappear almost entirely).
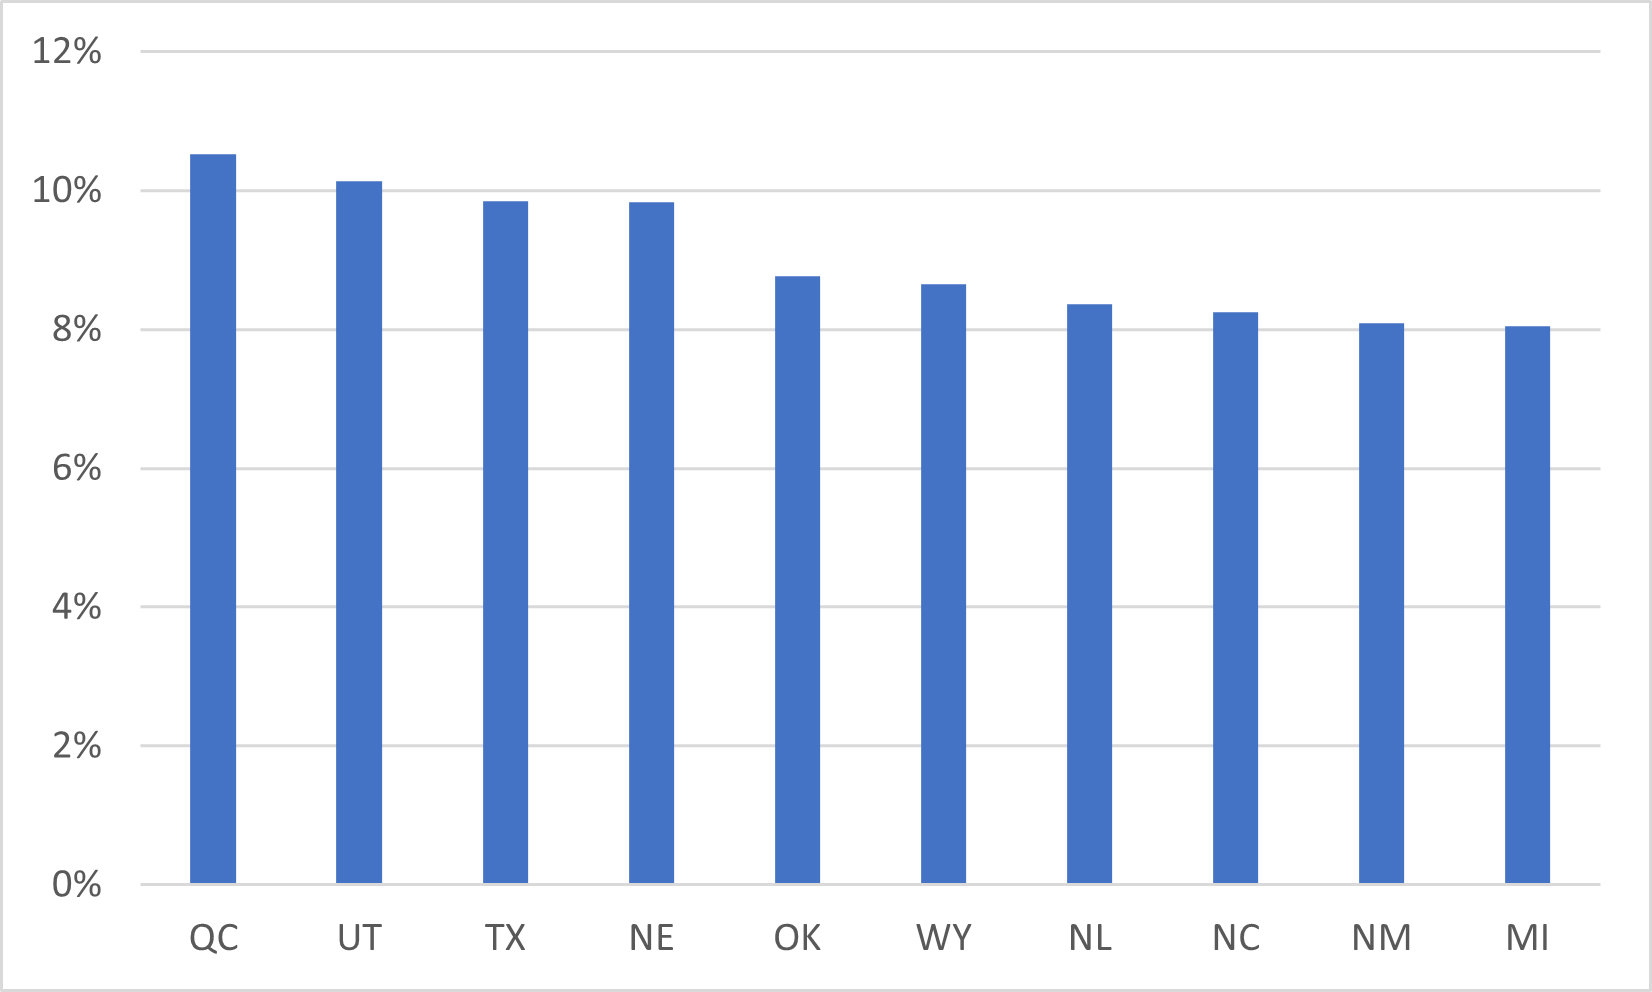
Anyways, just for giggles I thought it would be worth doing some US-Canada comparisons. Unfortunately, as can be seen in Figure 3 it’s hard to do much useful when you’ve got 50 jurisdictions on the same page, let alone 60, so I just decided to look at the top ten states/provinces. And boy, it’s not who you’d expect. Quebec, five of the reddest states you can imagine (an interesting challenge to the “Republicans hate higher ed” hypothesis), then Newfoundland, North Carolina, New Mexico and Michigan.
Figure 5: Top 10 State and Provincial Expenditures on Postsecondary, by Percentage of Total Expenditure
In any event, the takeaway here isn’t that the “% of total spending” is a “better” metric for comparison. There are legitimately different ways of comparing governments’ funding effort, each of which has its uses. The important thing is to triangulate and understand what each measure is telling you. In Canada’s case, it’s clear that the QC/NL/SK trio is at the top regardless of the measure, while Ontario tends to be at the bottom unless one also includes student aid expenditures. New Brunswick’s weak performance is to some extent masked by low student numbers, which makes even so-so aggregate investments look good on a per student basis.


One Response
Would be interesting to see numbers of students per capita. As you note, NB would be low. Looking at the PEI numbers I’d think they might be high.