


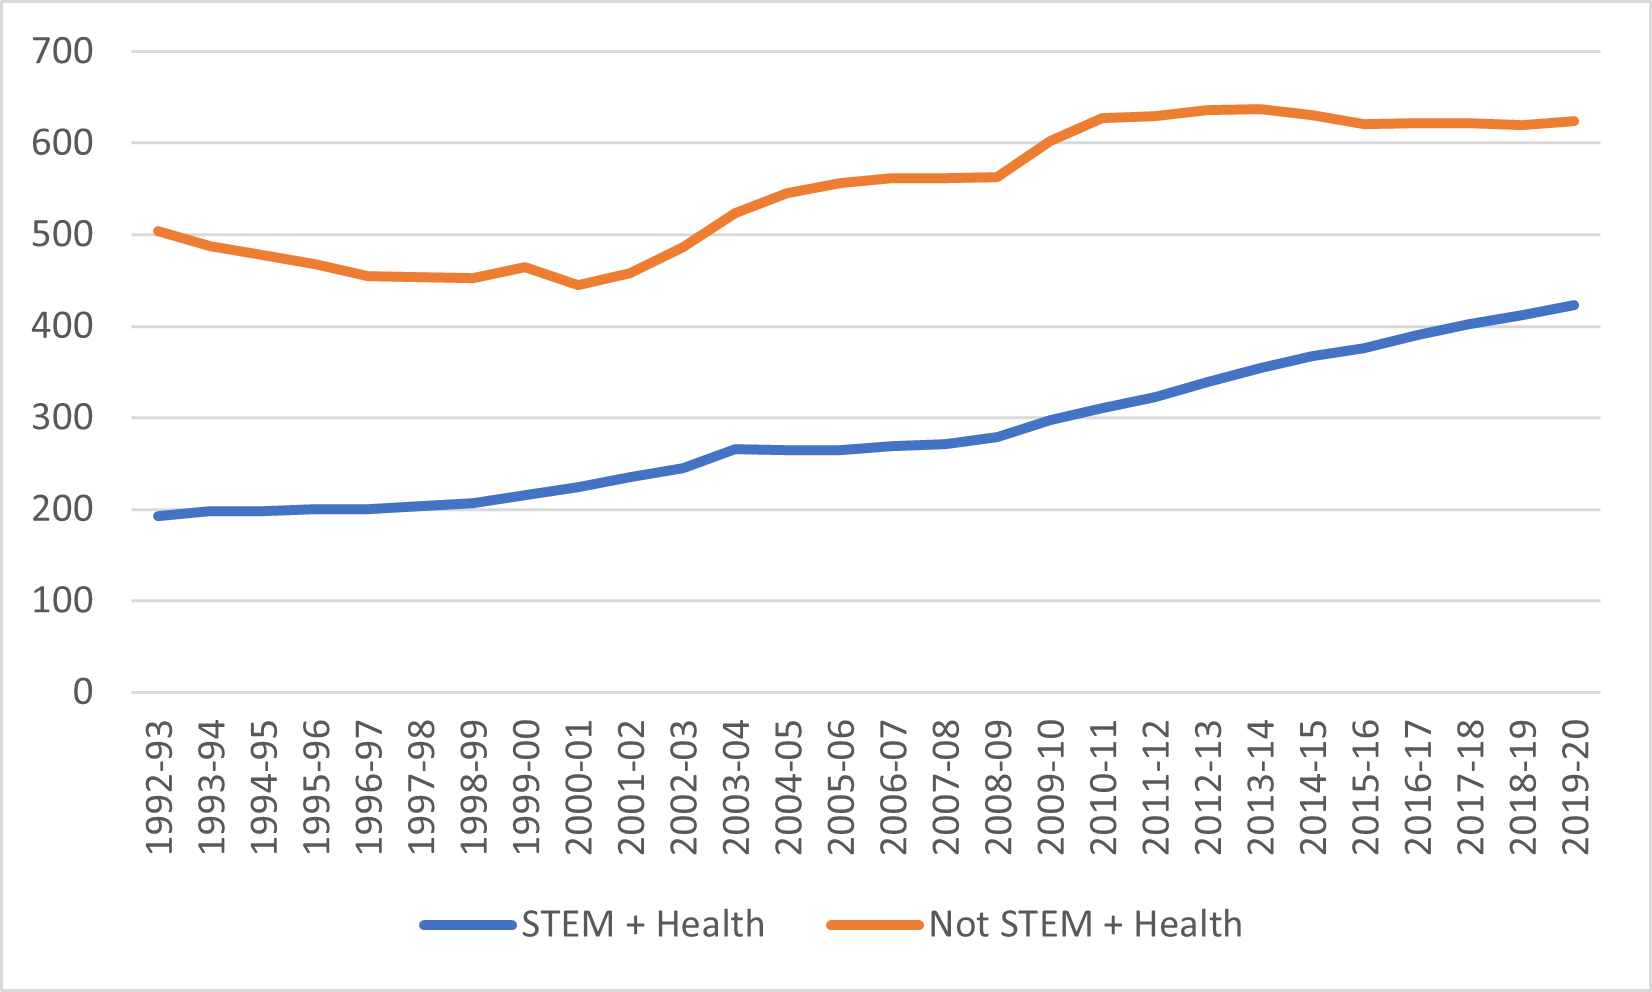
Just for kicks, let’s look at undergraduate enrolment data in Canada, shall we? Figure 1 shows enrolment trends at their very highest level: health and STEM subjects on the one hand and everything else (education, social sciences, business, humanities and fine arts) on the other. Basically, over the past 30 years or so, STEM and health programs have gone from educating a little over one in four undergraduate students to educating a little over four in ten today. Non-STEM/health fields grew quickly in the period 2000 to 2010, but since about 2010, effectively all growth has come on the STEM/health side.
Figure 1: Undergraduate Enrolments in Canada in 000s, Health + STEM vs. All Other Fields, 1992-93 to 2019-20
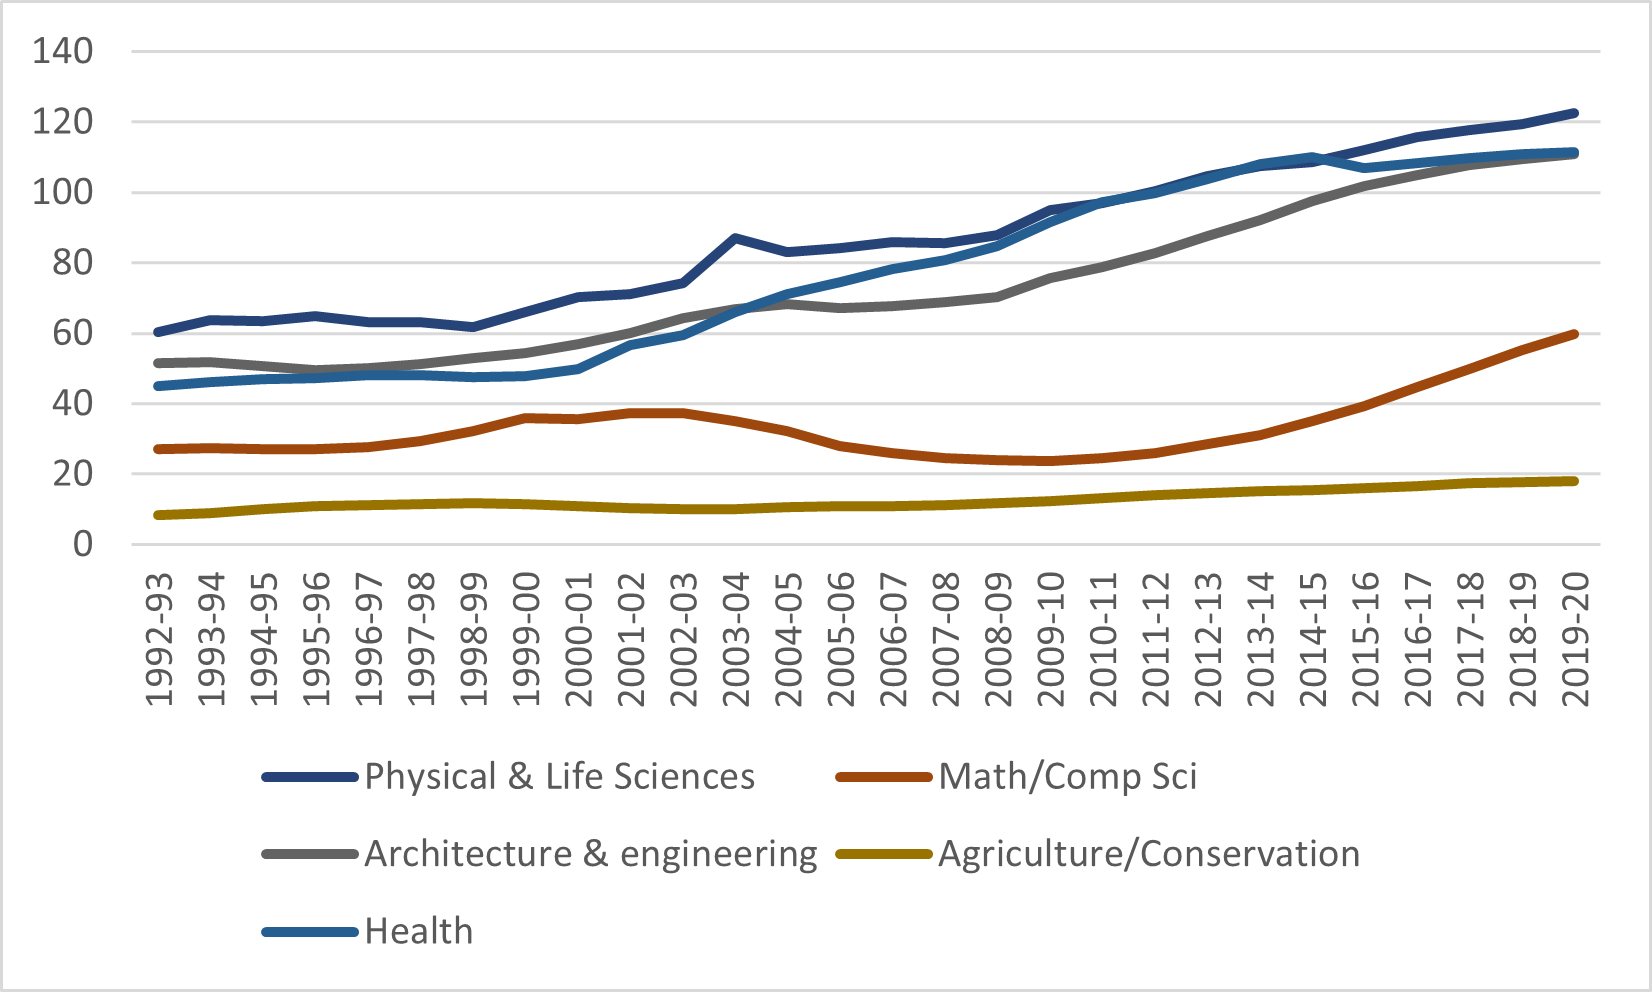
Now, let’s break this down even a little bit more and check out what exactly is happening on the STEM/health side. As figure 2 shows, growth has been strong and consistent across nearly all major sub-fields for the past twenty years, with numbers doubling in all areas. The only exception to the pattern of consistent growth is mathematics and computer science, which did double in size where the effects of the tech bust in the early 2000s led to a long decline in enrolments before a strong recovery in the past decade. Of some significance is the fact that health enrolments flattened out about five years ago.
Figure 2: Undergraduate Enrolments in STEM/Health fields, by Major Field of Study, Canada, in 000s, 1992-93 to 2019-20
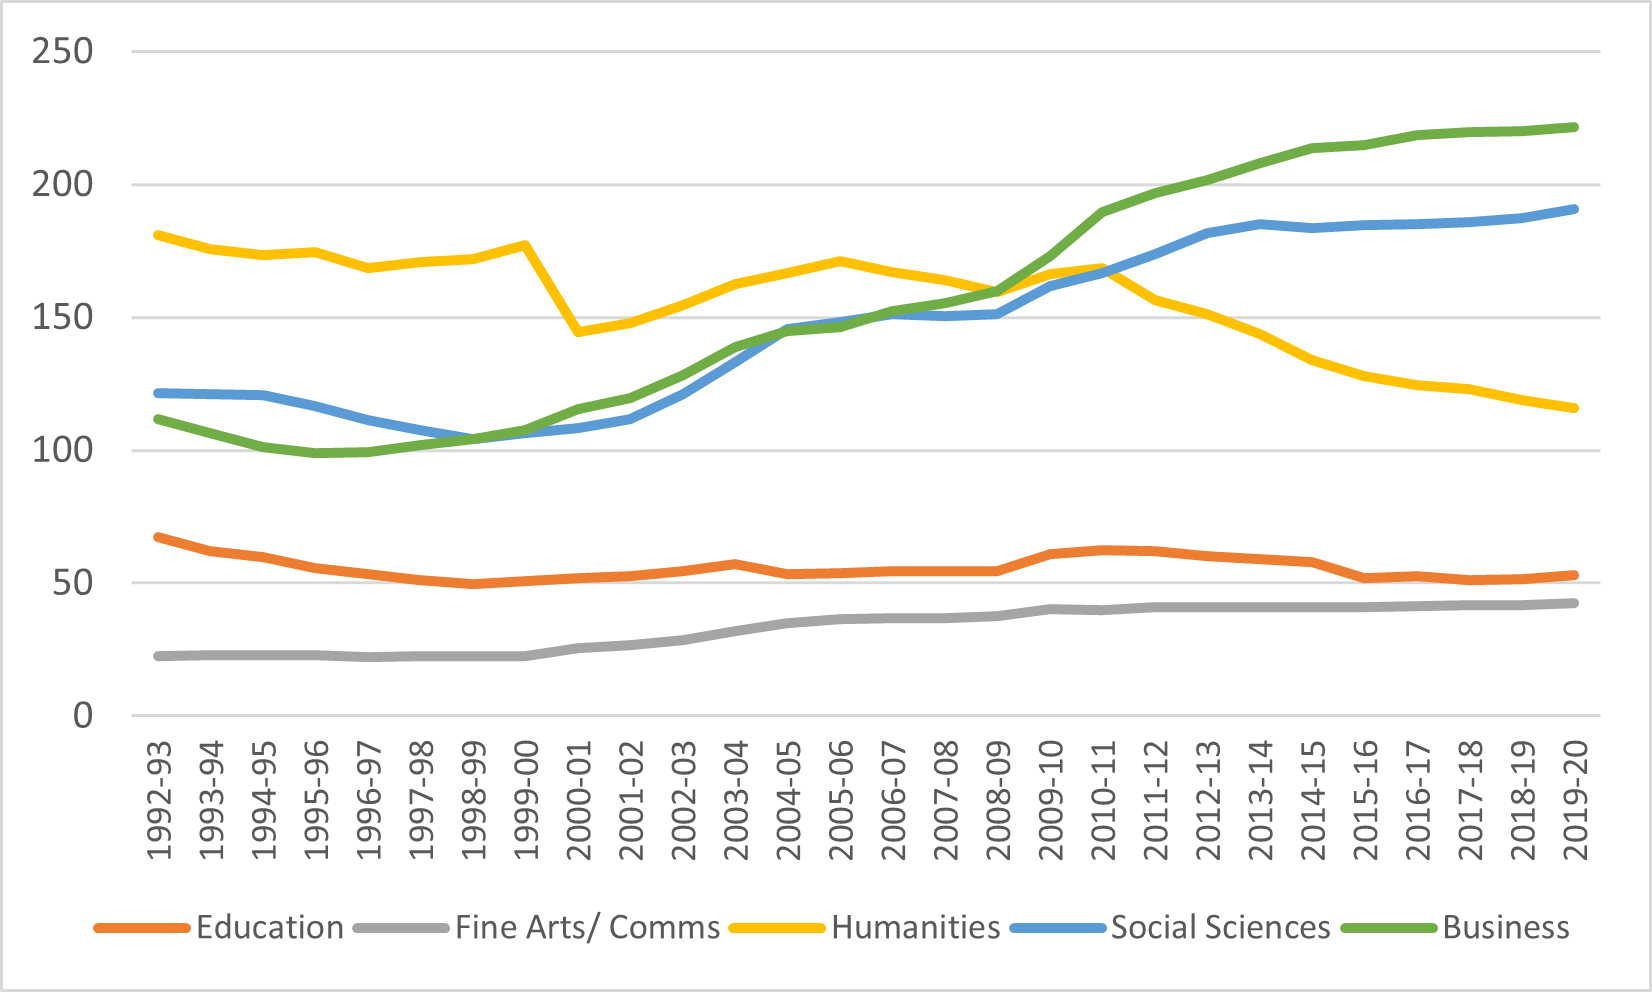
Now here’s the more interesting part. Among non-Health/STEM fields, we also see considerable growth in some areas. Business, for instance, more than doubled its enrolments between 1997 and the mid-2010s, before seeing growth flatten out in the past few years. Social science and – perhaps surprisingly – fine arts also saw significant enrolment growth over the past 25 years. The only parts of the academy where we have seen a decline are in education, where numbers have been flat in part because of demographic changes and changes in demand for teachers and, most notably since about 2010, humanities.
Figure 3: Undergraduate Enrolments in non-STEM/Health fields, by Major Field of Study, Canada, in 000s, 1992-93 to 2019-20
Now it just so happens that Statistics Canada has recently published some data back to about 2011 that allows us to get a little bit inside some of these broad categories, by what it calls “detailed field of study”. It’s somewhat wonky as a data source because i) its classifications of fields are a bit idiosyncratic and don’t quite correspond to how people in academia classify them, ii) when it comes to fields and subfields, there can be a lot of daylight between the totals of the subfields and the alleged totals of the fields that they collectively make up and iii) so far as humanities are concerned nearly all students are lumped into “general liberal studies” (because people in humanities often leave it quite late in their studies to declare a major, which is what these enrolment stats are counting). But this is Canada, we don’t often get data, so let’s give it a whirl.
Now the thing about humanities is that if you break it down on a disciplinary level, there are really only four big sets of departments: history, philosophy, literature (which usually is either called “English” or “Français” depending on which part of the country you are in) and languages/linguistics. There are literally dozens more fields, like “Ukrainian studies”, “peace studies”, etc, but they have small enrolments that are hard to plot alongside the other subject areas.
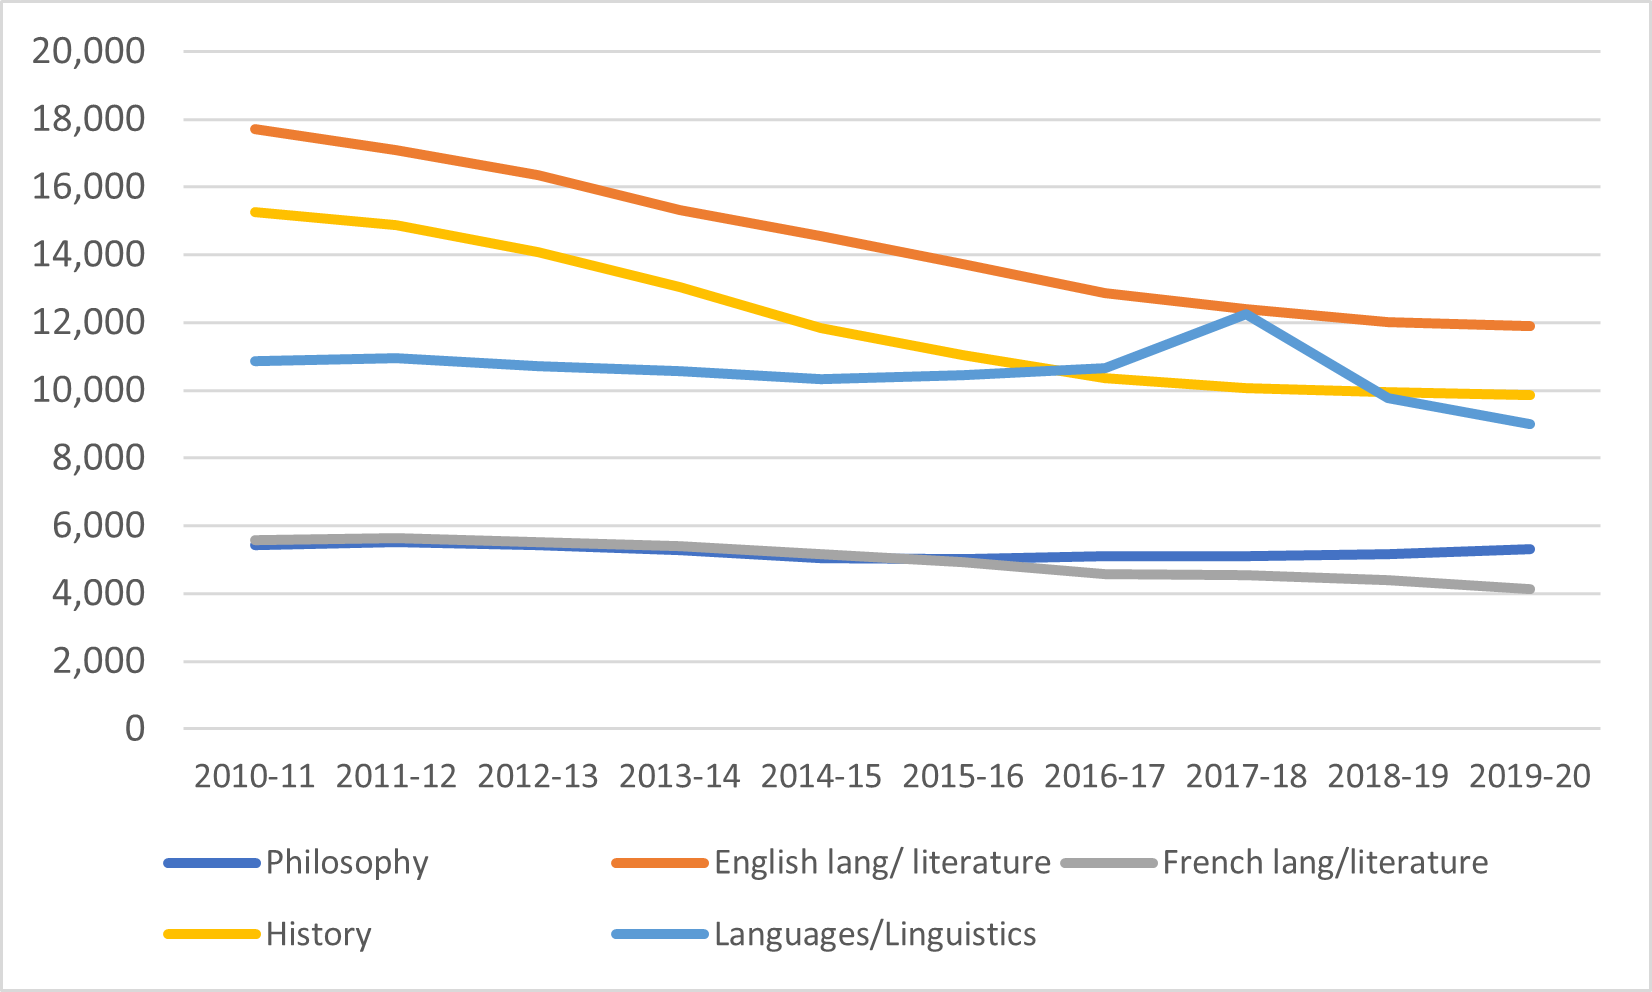
To the extent these enrolments can be known, figure 4 tells the tale. Philosophy is holding pretty steady in terms of majors, down just 2% over the decade. Foreign languages and linguistics are down somewhat, (I have no idea what the jump in 2017-18 represents, possibly one big institution misclassifying some students in one year), but the real story is in literature and history. French language and literature was down 26% over the decade, English 33% and History 35%. However, the curves for these majors appear to be flattening, suggesting that they have already hit their nadir.
Figure 4: Undergraduate Majors Within Humanities, Canada, 2010-11 to 2019-20
In sum: i) enrolments universities are shifting towards engineering and health programs (which are more expensive to deliver) even though provinces are providing no financial assistance to do so; ii) the big growth phase in both business and health seems to be over, iii) the narrative humanities (history and literature) have had a torrid time in past decade but appear to have halted their decline and iv) Philosophy somehow managed to avoid the declines hitting the rest of the humanities.


One Response
Interesting numbers, if depressing from the Arts perspective. I’d like to see the gender breakdown. I suspect Philosophy is doing OK because it continues to attract men who are using it as a pre-law degree. My English program, in contrast, is about 15% male (well below the Arts average which I think is about 35 or 40%). If we attracted as many men as we do women, we’d be doing OK. If we attracted the same ratio of men to women as Philosophy we (i.e. English) would be doing OK. To be clear, I’m not suggesting that we turn ourselves into the Hemmingway Program for the Study of War in Literature. That kind of pandering to supposedly masculine interests has been tried and, predictably, failed. Rather, English, History and a variety of other programs in the Arts have been labelled in the culture at large as “feminine”, and this has hurt our numbers. I don’t know how to work against that.