


Yesterday, I said that the system of English student loans were the worst in the world. And I know the skeptical among you probably thought “how can he say that? Where is the comparative data?” So, today, some data on student loans programs around the world which will show, definitively, how awful the English system is.
Let’s start with a basic piece of contextual data, which is that there are huge differences between countries when it comes to the percentage of students who end up with debt. To some extent that is due to eligibility rules (e.g. Canada uses need assessment to prevent many students from borrowing) while in other cases it reflects different proclivities to borrow (loans are more or less automatically available in both UK and Sweden, but the two nevertheless actually have quite different incidences of indebtedness). Germany, which has very tight aid eligibility criteria, has a very low percentage of graduates with debt, but this shouldn’t necessarily be thought of as a good thing as it probably means there are a lot of students who need money but are not receiving it. And as you can easily see, tuition levels don’t have a lot to do with borrowing levels: Sweden and Norway are tuition free and yet borrowing is well above where it is here in Canada.
Figure 1: Percentage of Bachelor’s Graduates with Student Debt, Selected OECD Countries, Most Recent Year Available (usually 2023 or 2024), in USD at PPP
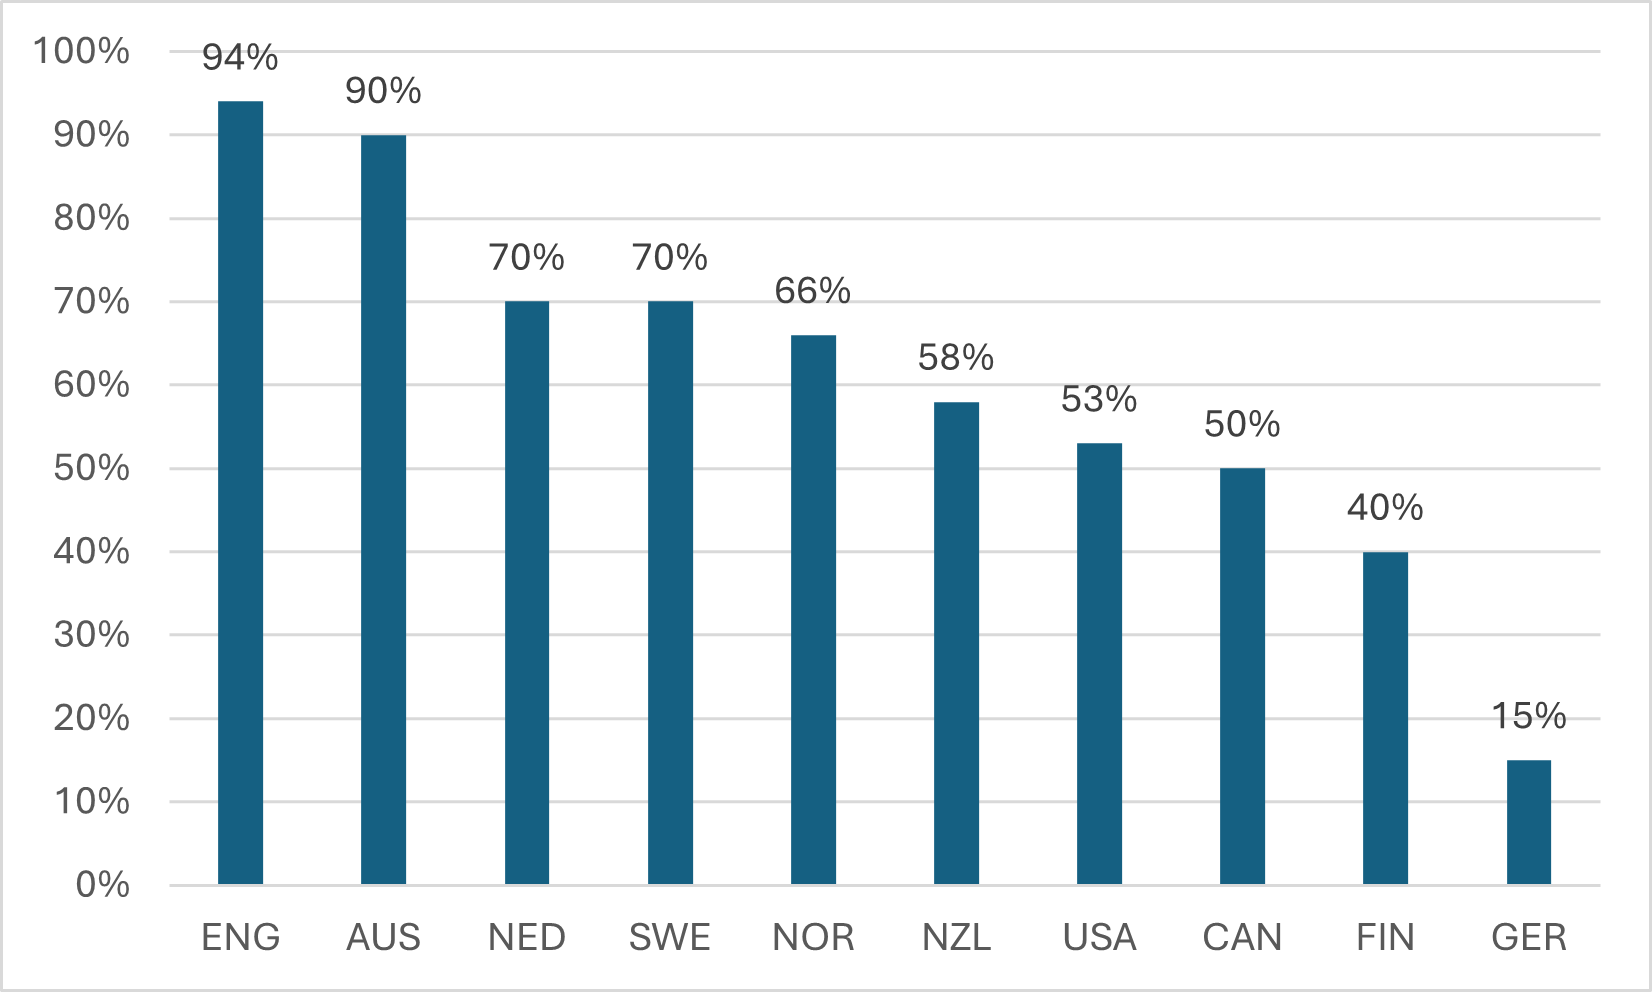
Figure 2 looks at actual levels of debt at graduation across our selected group of countries (in all cases the data is form official sources, except Germany where some interpolation was required). In all cases, these debt levels only include debt for those who borrowed – that is, non-borrowers are excluded from the averages (but of course if you want to make that calculation you can always use the data from figure 1). For reasons I discussed yesterday, debt in the UK is much higher than anywhere else in the world at about $75,000 USD. There is then a group of countries (USA, Norway, Finland, and the Netherlands) where average debt at graduation where debt is around $30,000 USD, and another group (Canada, Australia, New Zealand, and Sweden) where debt is closer to $20,000 USD. At the bottom of the list is stingy Germany, where debt is around $10,000 USD.
Figure 2: Student Debt at Graduation, Bachelor’s Graduates, Selected OECD Countries, Most Recent Year Available (usually 2023 or 2024)
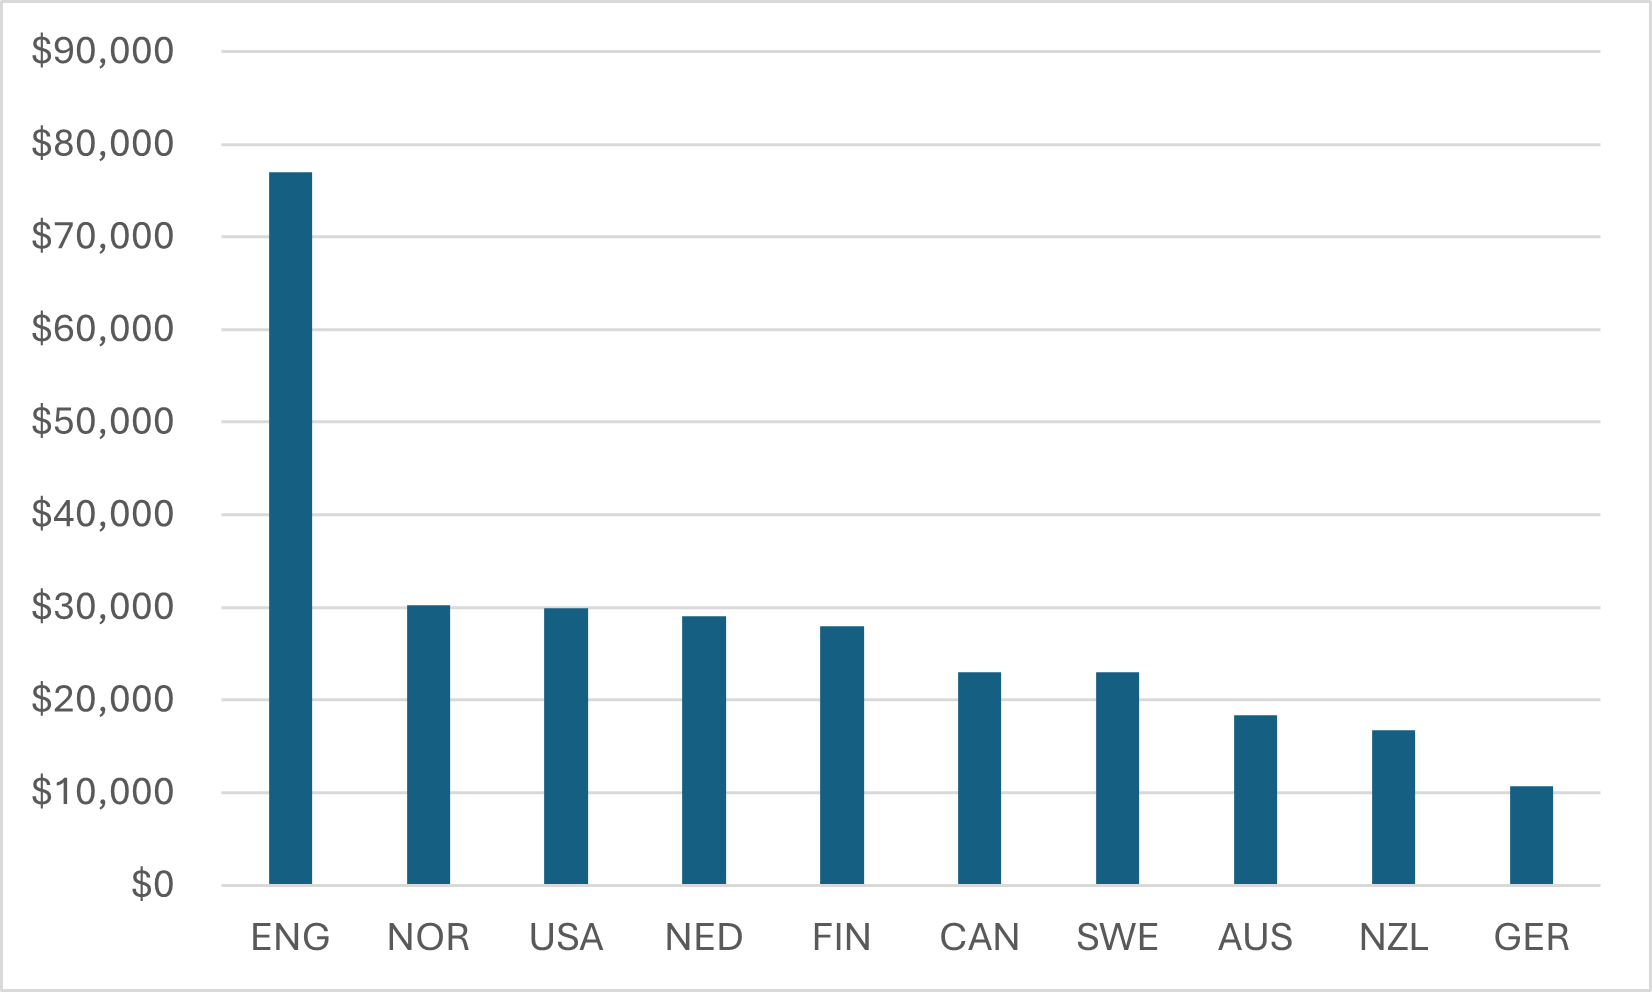
Some people will no doubt find figure 2 confusing. How is debt in free-tuition Norway higher than in notoriously high-debt America? Well, the quick answer is that most of those high-debt stories you hear from the US are about students in graduate and professional programs. Actual undergraduate debt is, in comparison, fairly moderate. Meanwhile over in Scandinavia, governments view student aid not just as a way to help students go to school, but also for them to become independent adults. As a result, the allowances for living expenses are quite generous and since students tend to try to maximize current living standards, that result is quite high levels of student borrowing and debt.
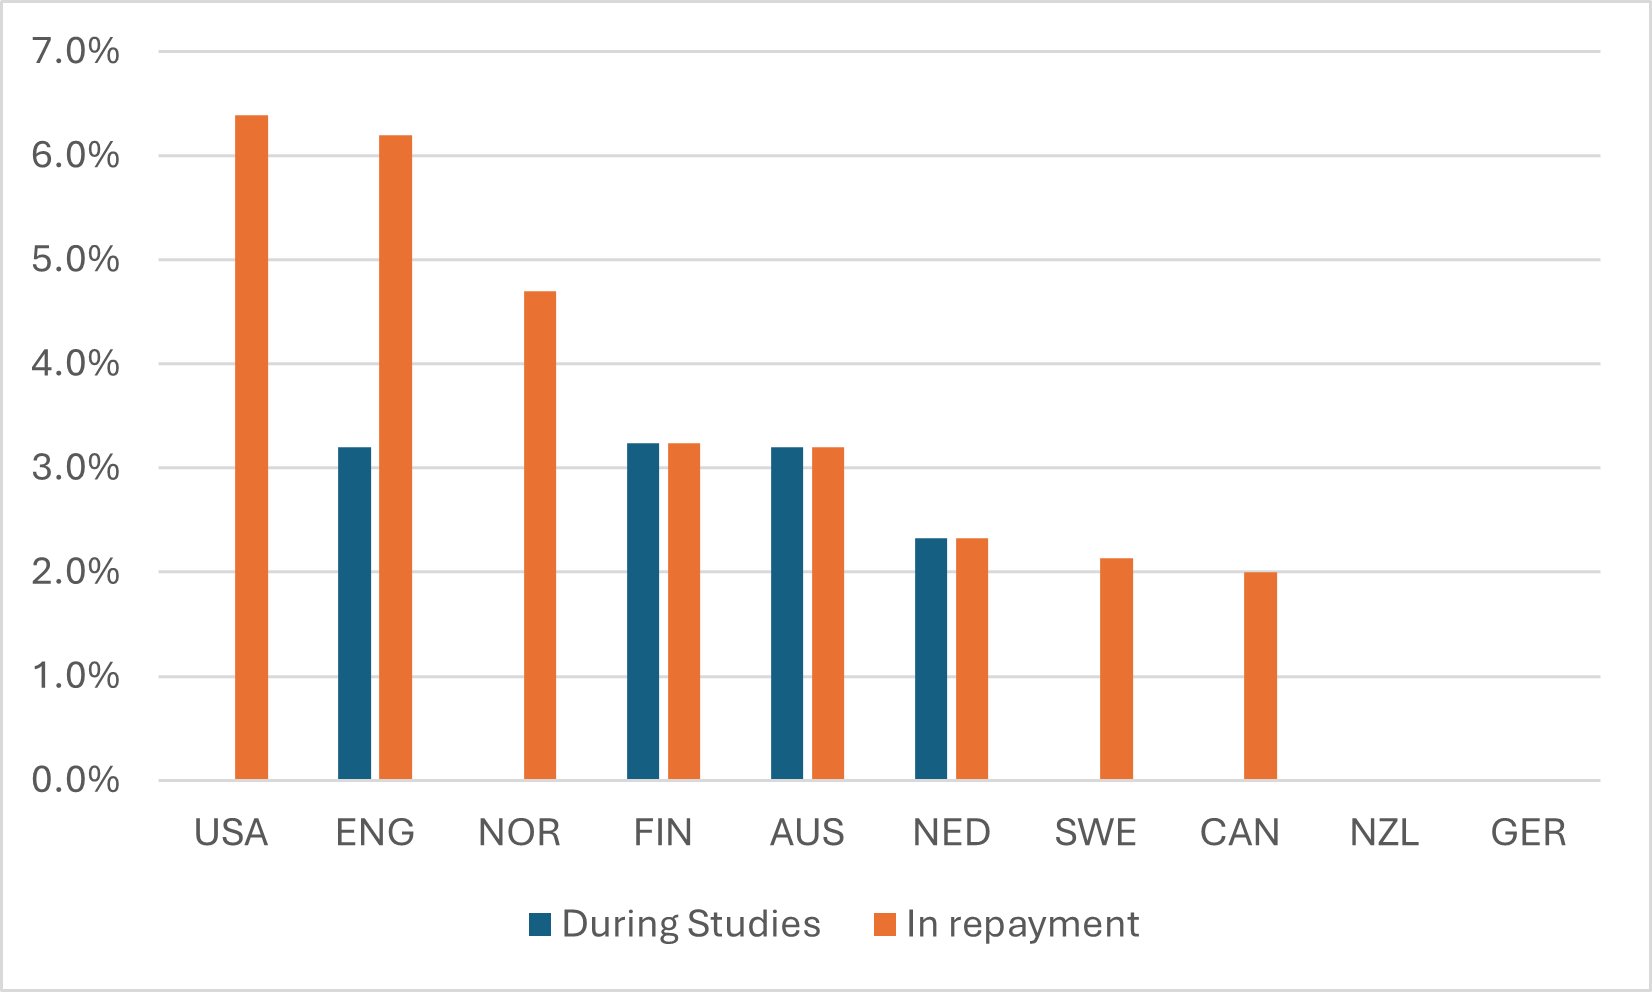
Now let’s move to loan interest. There are basically four ways of setting loan interest rates. They can be set at zero, they can be linked to inflation, they can be linked to government rates of borrowing, or they can be charged at something like market rates. Germany and New Zealand both charge zero though the life of the loan; Australia charges inflation through the life of the loan, and in the Netherlands, interest is linked to government bond rates through the life of the loan. Other countries change the nature of the interest rate; for instance, the US charges zero during studies but something close to market rates when loans are in repayment. Canada is even more complicated in that federal loans are set at zero for the life of the loan, while in repayment federal loans are zero-rated while most provincial loans carry something like a market rate (the 2% rate shown in the graph is a rough approximation of the blended rate of interest for the two sets of loans).
Figure 3: Interest Rates on Student Loans, selected OECD Countries
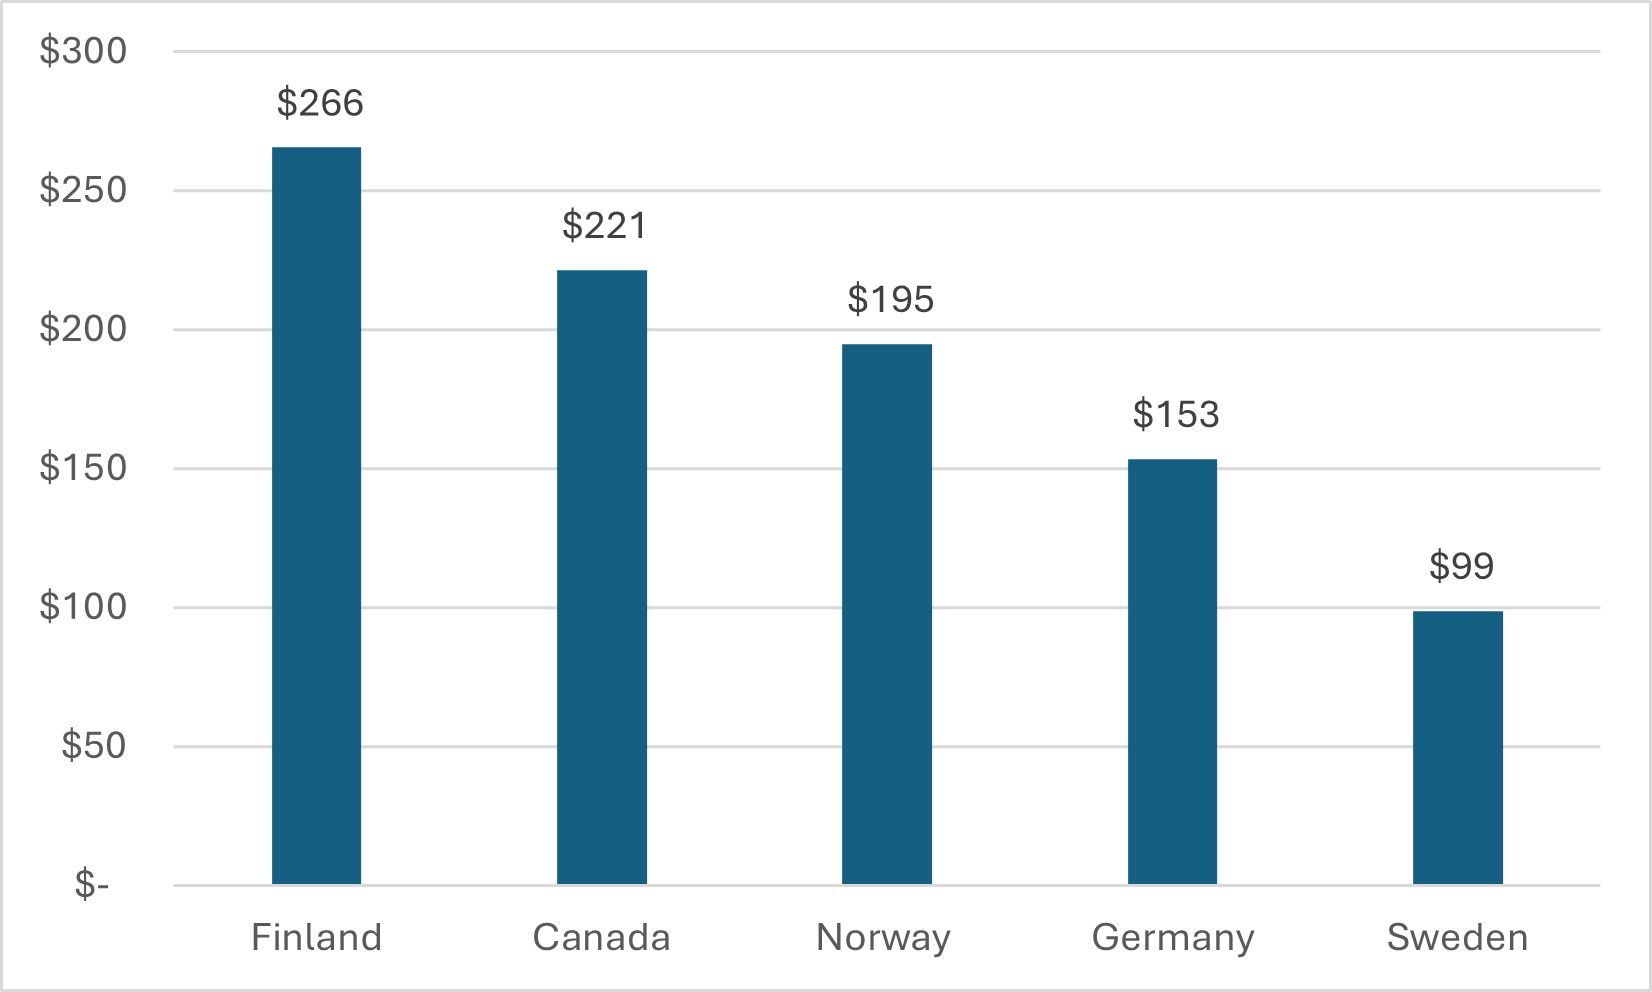
Now on to repayment. Four countries in our list have simple amortization loan repayment: Norway, Sweden, Finland, and Germany. In these countries, monthly repayments can carry quite a bit based on interest rates, and mandated repayment period. So even though Finnish and Swedish students graduate with similar levels of debt, Finnish graduates have higher monthly loan payments schedules than Norwegian ones because they have a shorter repayment period. (Canada is presented simply for comparison purposes; in fact, it has an income-contingent loan system which means most recent graduates pay nowhere near this much).
Figure 4: Monthly repayment amounts in Countries With Mortgage-style repayments
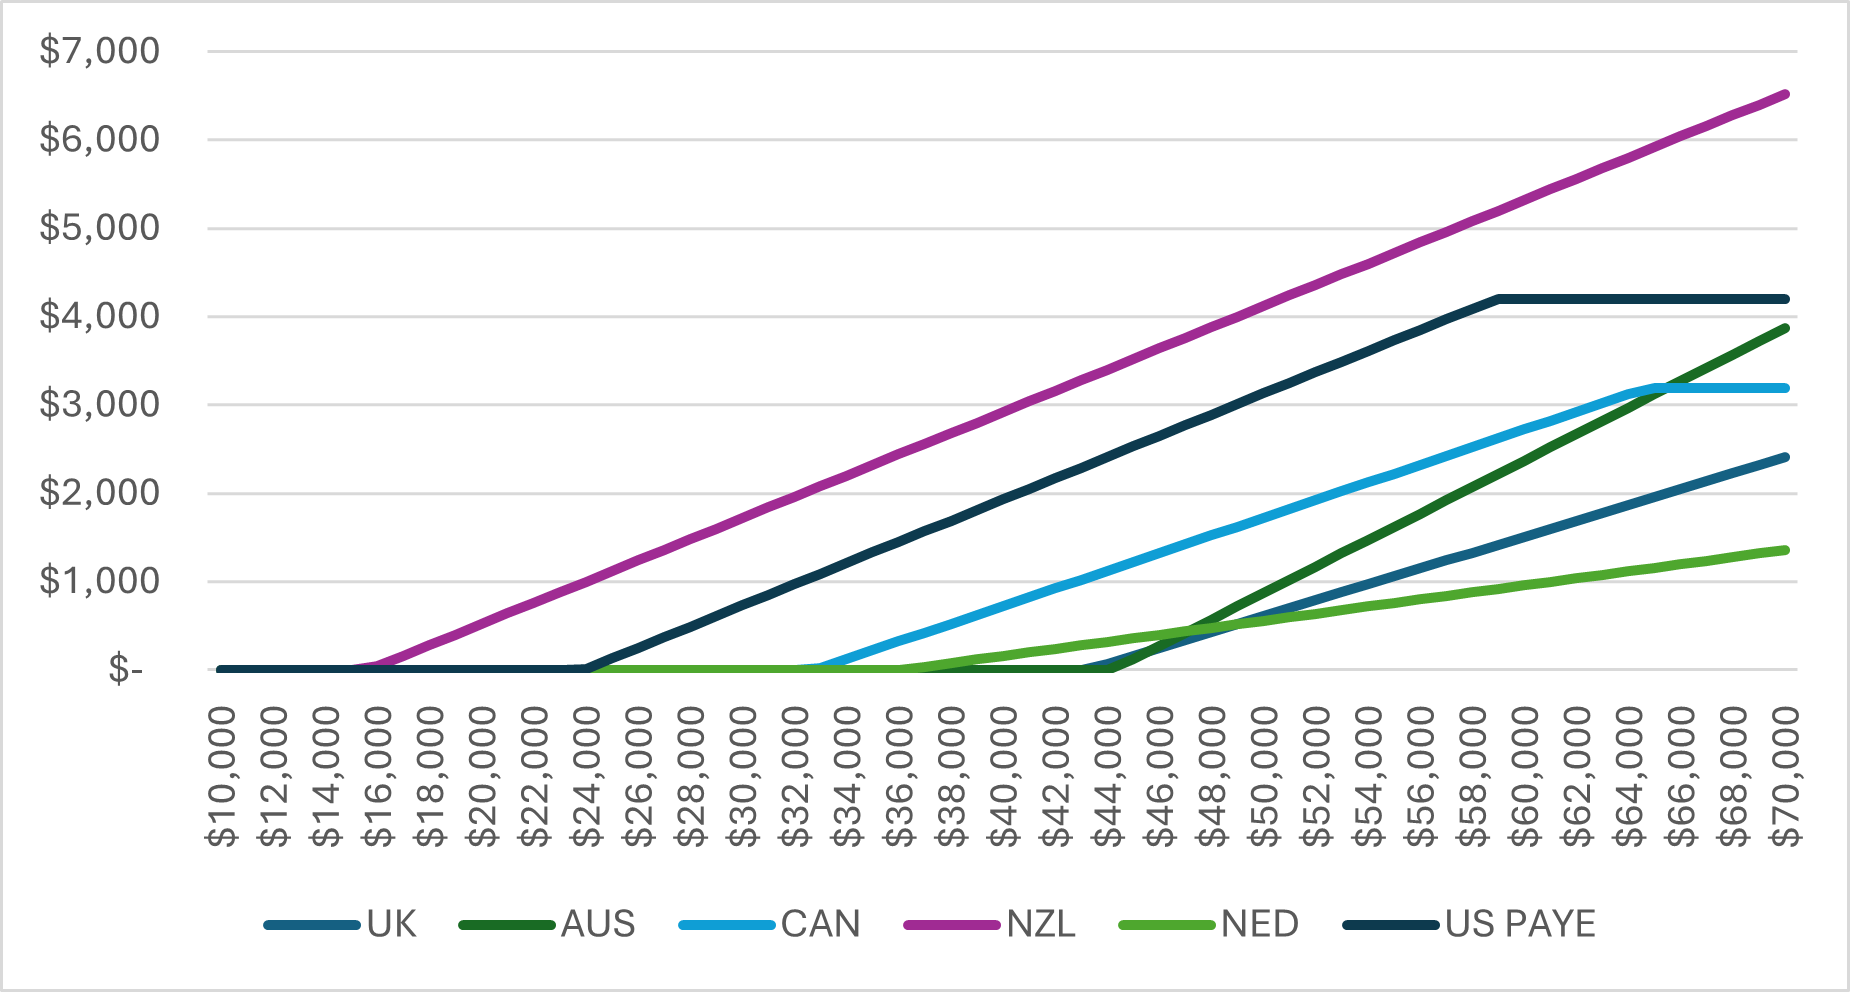
In income-contingent systems, interest rates and repayment period do not matter in terms of setting repayment amounts. Instead, repayment amounts are simply a function of income. Each system has its own repayment threshold (that is, the level of income below which no payments are made) and the rate of marginal income that is required to be repaid above that threshold. So, for instance, New Zealand has by far the lowest threshold and the second-highest rate. Therefore, the repayment burden for graduates in New Zealand are considerably higher than they are anywhere else (the flip side: students there are debt free a lot faster than anywhere else). For other countries, the question of which system is better depends to some extent on what your income level is: Australia’s system has the highest threshold and is therefore quite comfortable for students earning about $45,000 USD but the marginal repayment rate is so high that by the time income rises above about $70,000, making it one of the most burdensome for students. (Canada and the US look different from the others because the marginal repayment rate ceases to be in effect once a student reaches the point where the algorithmic repayment rises above the level of what a student would pay if they were paying off a loan on a ten-year mortgage-style amortization schedule. They are allowed to switch back over to that schedule, thus in effect creating a “cap” on payments which does not exist in other ICR systems.)
Figure 5: Monthly repayments in Countries with Income-Contingent Repayment Systems, USD at PPP
So that’s the quick overview. As to the question of whether loans in England are worse than others: I think it’s reasonably obvious that a) the debt levels are extraordinarily high, and b) on most other points of comparison, the UK may not come out looking the worst, but it usually doesn’t come out very well, either. Canada, meanwhile, looks reasonably good on both measures (or at least it did until the federal government and the Government of Ontario began cutting back on grants…maybe let’s check back in a few years and see how we look).


One Response
Hi,
Are you using ENG in the above graphs to represent England solely or including Scotland, Wales, and Northern Ireland in the mix. I’m not clear if the student loan systems work differently in Scotland, Wales, and Nth. Ireland.
Thanks for clarifying.