


Last Thursday was that frabjous day which every higher education nerd has pencilled into their calendar: where Statscan publishes post-secondary enrolment data and for one brief moment we go from having enrolment data which is 37 months out of date to a mere 25 months out of date. Now, the big picture will be familiar to everyone who read The State of Post-Secondary Education in Canada, because I already went and got most of this data from institutional websites, but the Statscan data is a bit more complete, particularly at the college level, so it’s worth going through some of the numbers.
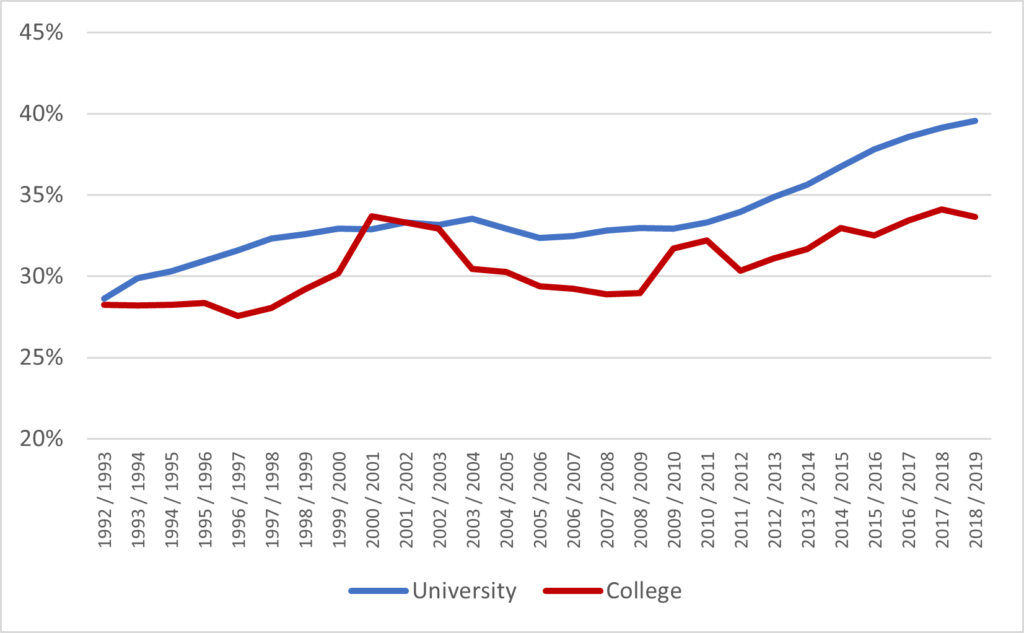
Let’s start by digging into the international numbers. Figure 1 shows international students as a percentage of the student body by sector. The steady upward progress of numbers is not a surprise; what is perhaps more surprising is the very sudden and quick growth in the college sector. As of 2018-19, the college sector had a larger fraction of international students (16.2%) than the university sector (15.7%).
Figure 1: International Students as a Percentage of Student Body, By Sector, Canada 1992-93 to 2018-19
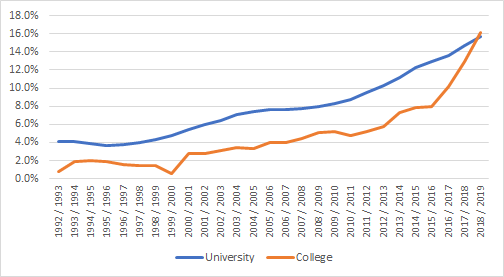
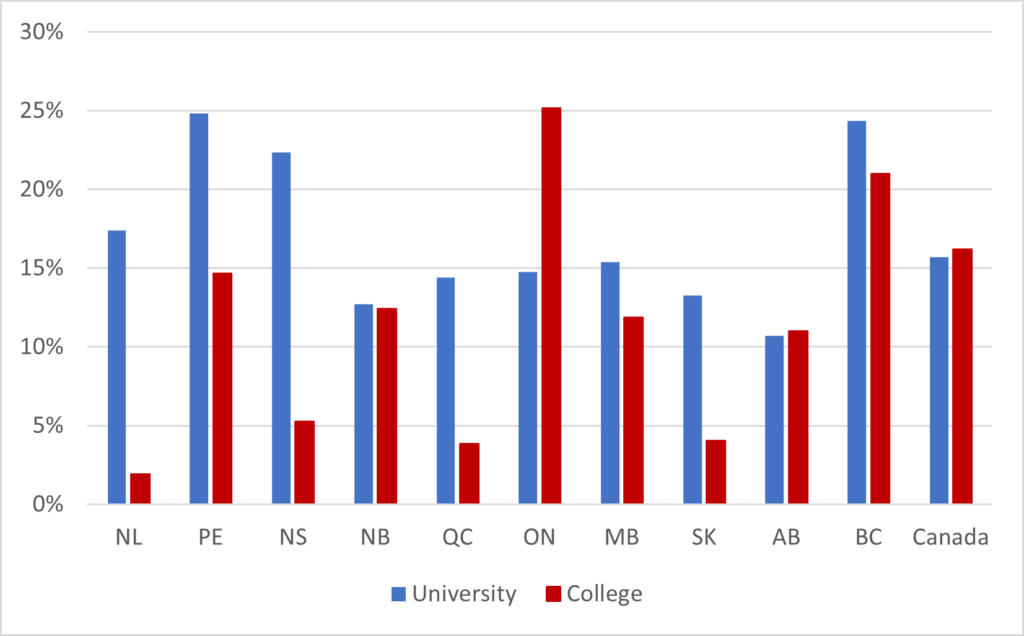
Figure 2 shows us that these international students are not distributed equally across the country. The Ontario college sector is now made up of 25% international students; in Newfoundland, the equivalent figure is under 2%. In the university sector the variation is not quite so large; Prince Edward Island is at just under 25%, slightly ahead of British Columbia, while Alberta is jut under 11% (but boy you can bet that’s going to change soon).
Figure 2: International Students as a Percentage of Student Body, By Sector and Province, Canada, 2018-19
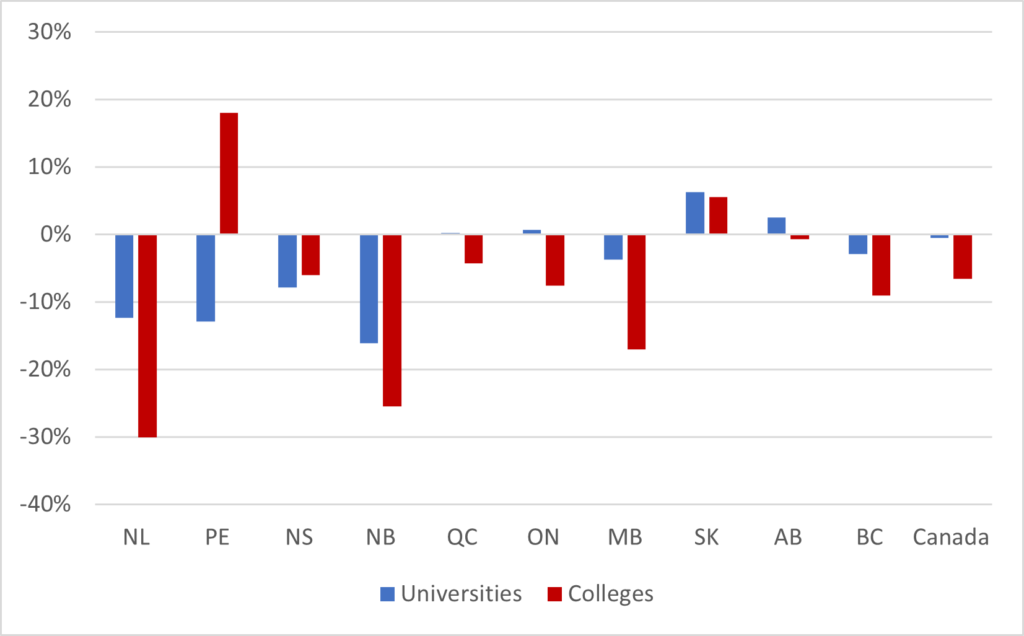
One of the hidden secrets of Canadian post-secondary education is that the country hit peak domestic enrolment in 2012/2013. Since then, as Figure 3 shows, university enrolments are down half a percentage point while in community colleges it is down by 6.6%. Saskatchewan, Alberta and Ontario are the only provinces that have seen growth in domestic university enrolments; Saskatchewan and Prince Edward Island are the only provinces to have seen domestic enrolment growth on the college side. New Brunswick and Newfoundland have seen double-digit declines in both sectors.
Figure 3: Percentage Change in Domestic Enrolment, By Sector and Province, Canada, 2012-13 to 2018-19
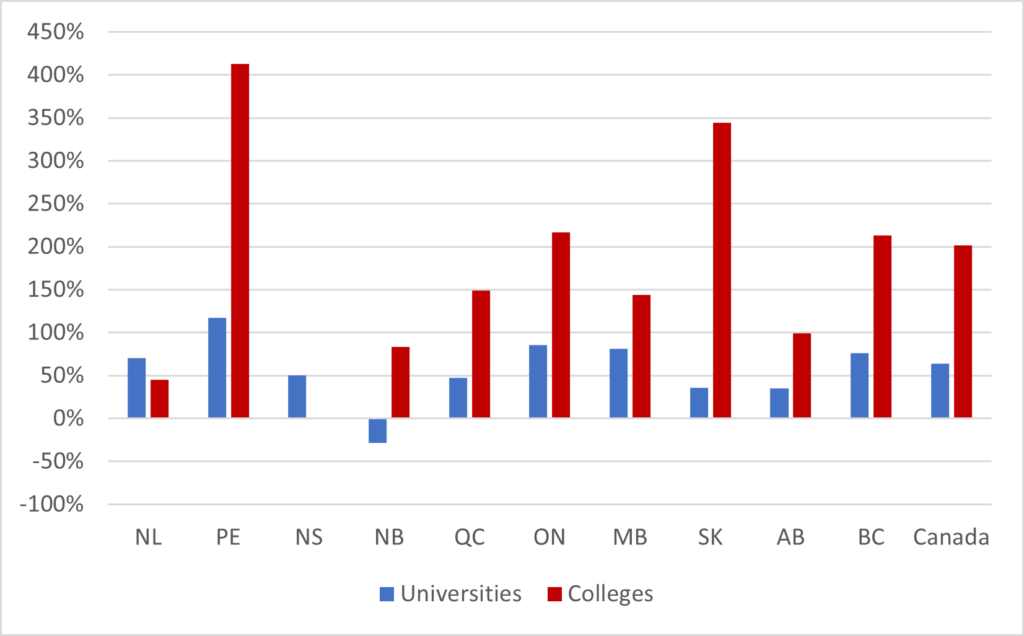
That’s the bad news. The good news, shown below in Figure 4, is that growth in enrolment in international students over the same period is off the charts: 64% in universities and – hold on to your seats – 202% in colleges (meaning enrolments tripled). Six provinces saw triple-digit growth in international enrolments in the college sector (though in fairness in PEI and Saskatchewan these were from pretty low bases). This has meant that even though domestic enrolment started slumping in 2012-2013, total enrolments have in fact risen 6%. The only small fly in the ointment here is that somehow – somehow – New Brunswick managed to lose international enrolment, which is a truly remarkable result given everyone else’s performance.
Figure 4: Percentage Change in International Enrolment, By Sector and Province, Canada, 2012-13 to 2018-19
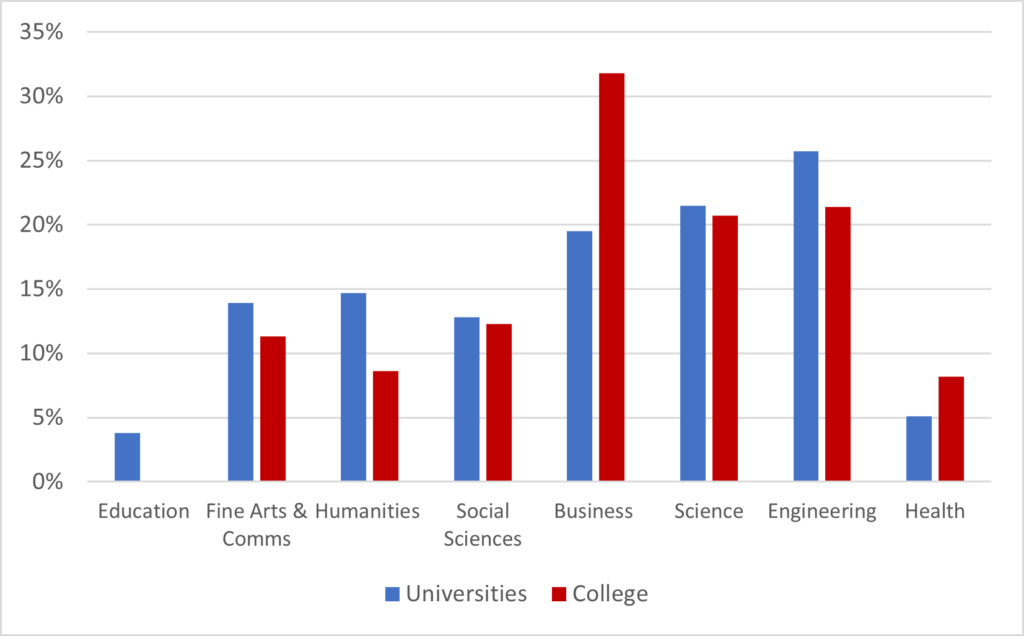
In what fields do international students study? No real surprise here: it’s high in business, science and engineering, low in regulated professions (education, health) and everything else is in-between.
Figure 5: International Students as a Percentage of Student Body, By Major Field of Study, Canadian Universities, 2018-19
Speaking of fields of study, one thing last week’s numbers show quite clearly is the ongoing shift towards science-based fields in Canadian post-secondary education. If one combines the STEM fields with the health fields, as done below in Figure 6, then we see 40% of university students are enrolled in these sectors, along with 33% of college students. But more surprising is how quickly this shift is happening: in the past decade, the figures have risen by seven percentage points in the university sector and five points in colleges. This suggests that perhaps post-secondary institutions are not, in fact, all that slow at reacting to changes in demand.
Figure 6: Percentage of Total Enrolments in STEM + Health, By Sector, Canada, 1992-93 to 2018-19
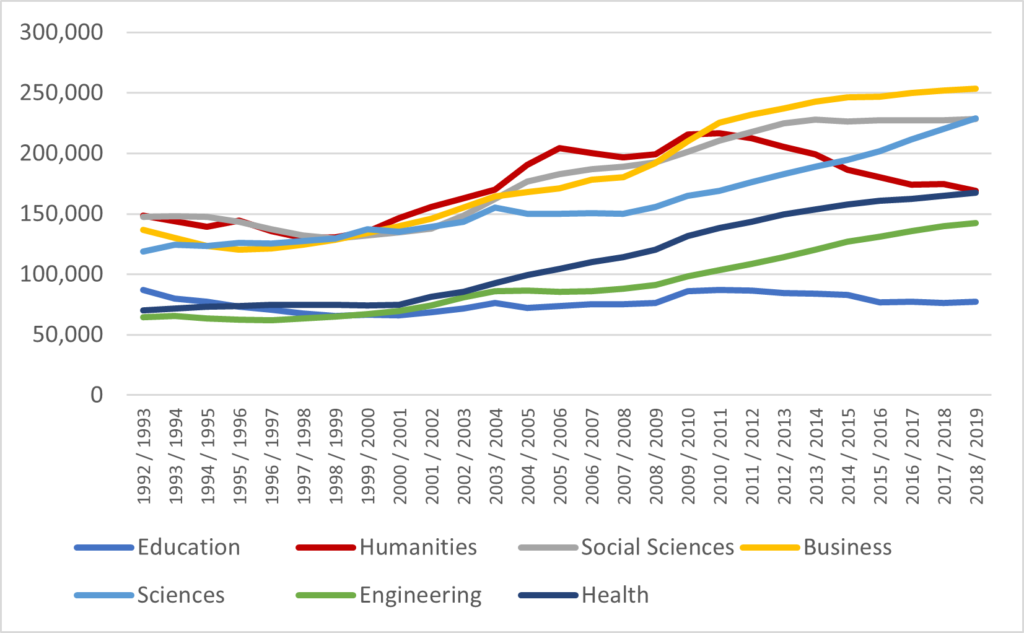
I am including Figure 7 here because someone always asks: what’s going on with the humanities? Well, the quick answer is that the decade-long drop in numbers resumed in 2018-19 after briefly flattening out the previous year. Every single one of the other major fields has seen growth in the past decade. Engineering? Up 56%. Sciences? Up 47%. Health? Business? 39% and 32%, respectively. Humanities, meanwhile, are down by 15% on 2008-09, and down 22% on their all-time high in 2010-11.
Figure 7: Enrolments by Major Field of Study, Canadian Universities, 1992-93 to 2018-19
And with that, we can say goodbye to enrolment data for another year and wait for Frabjous Statscan Day 2021.


One Response
Thank you for this data.
Could you provide data that tracks the completion of University Degree Programs by IB students who enter Canadian Universities? Then maybe present this data as a GRAPH? Could you also do this same request for ONTARIO-based Universities?
This data may exist somewhere, but I am unable to find it.
Thank You
Dr. K. Reid