


This data is a little old (2012), but it’s interesting, so my colleague Jacqueline Lambert and I thought we’d share it with you. Back then, when HESA was running a student panel, we asked about 1350 university students across Canada about how much they spent on textbooks, coursepacks, and supplies for their fall semester. Here’s what we found:
Figure 1: Distribution of Expenditures on Textbooks (Fall Semester 2012)
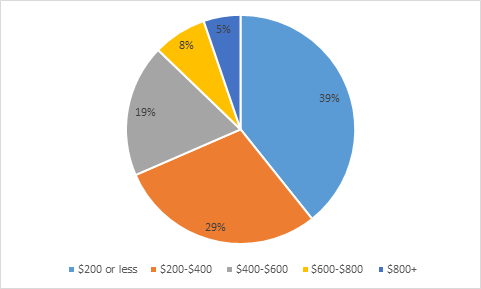
Nearly 85% of students reported spending on textbooks. What Figure 1 shows is a situation where the median amount spent is just below $300, and the mean is near $330. In addition to spending on textbooks, another 40% or so bought a coursepack (median expenditure $50), and another 25% reported buying other supplies of some description (median expenditure: also $50). Throw that altogether and you’re looking at average spending of around $385 for a single semester.
That’s a fair whack of cash. But what’s interesting here is not what they paid, but how they chose to save money. After all, students have a number of potential strategies to avoid purchasing textbooks: they can sign them out of the library, they can buy them used, they can share with friends, and in some cases find pirated electronic copies on the internet. To observe how students were actually behaving, we asked them not just how much money they spent, but also: i) whether they actually bought all the required books and materials; and if not, ii) how much they would have spent if they actually had bought all the books.
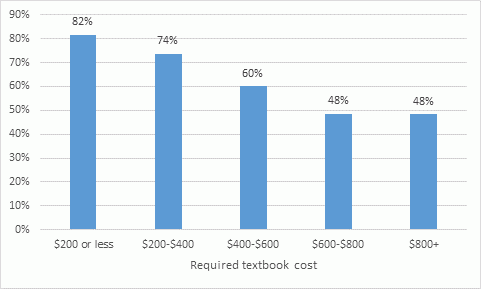
Overall, two-thirds of students said that they bought all of their required textbooks. But the proportion who said they did fell fairly dramatically as the overall cost of buying textbooks increased.
Figure 2: Percent of Students Saying they Bought all Required Textbooks, by Overall Required Textbook Costs
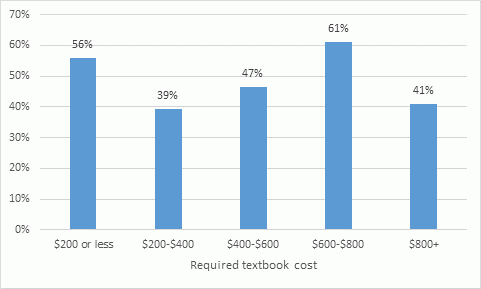
So most students pay the full amount – but as figure 3 shows, those who don’t pay the full amount can actually underspend by quite a bit. Somewhat surprisingly, while the proportion of those paying the full amount goes down in as costs increase, the same is not true of the portion of the full bill paid by those who do not pay. In fact, the relationship between total required costs and the proportion of total costs paid by those paying less than 100% is completely non-linear.
Figure 3: Proportion of Total Textbook Costs Paid by Those Students who buy Less Than 100% of Recommended Books
So there you have it. We’re not sure any of this means much, but more data is better than less data.


4 Responses
This is very useful data, Alex. Thank you for posting.
I’m assuming this is data on Canadian university students.
Can I ask how many students responded to the survey? Also, from what provinces?
Hi Nick. Yes, Canadian university students. 1300 or so responded, IIRC. I couldn’t tell you the exact numbers by provinces off the top of my head, but the sample was drawn from a panel which was broadly representative of the nine provinces other than QC; national results were then weighted to reflect actual regional enrolment #s.
Perhaps this should be obvious or I missed it: please tell me you have accompanying stats on how many courses the students were taking in the semester? Or the sample only included full time registrants?
I can’t help but wonder because when I wander through our bookstore, the figure of around $200/term seems awfully low!
It would be interesting to determine whether students’ cost-savings efforts impact their studies; i.e. are they using their texts less or less optimally because they are trying to save money?
Hi,
Do you have older/more recent data to compare?
Very interesting data, thank you!