


As I said yesterday, there’s a quick way to check claims of relative underfunding in block-grant provinces: take each institution’s enrolment numbers by field of study from Statscan’s Post-Secondary Student Information System (PSIS), plug those numbers into the Ontario and Quebec funding formulas, and then compare each institutions’ hypothetical share of total provincial weighted student units (WSUs) under those formulas to what we know they actually receive via CAUBO’s annual Financial Information of Universities and Colleges (FIUC) Survey.
Simple, right? Well, no, not really, but I have some really talented staff who do this stuff for me (Hi Jackie!), so let’s go look at the data.
Let’s start with Manitoba, where pretty much every second day you can hear the University of Winnipeg making a case about relative underfunding (say what you will about Lloyd Axworthy: the man knows how to keep his message in the newspapers). But is the claim true?
Figure 1: FTEs, Weighted FTEs, and Actual Funding, Manitoba Universities
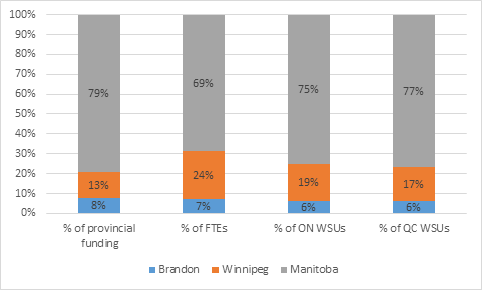
Here’s what Figure 1 says: The University of Manitoba has 69% of the province’s students, but receives 79% of all provincial funding (this is from 2011-12); The University of Winnipeg, on the other hand, has 24% of the students, but only 13% of the total funding. Clear cut case of underfunding, right?
Well, not entirely. The fact is that Manitoba has a lot more students in high-cost disciplines than does Winnipeg. If U of M were in Ontario, it would get 75% of provincial funding; if it were in Quebec (where the formula is slightly more tilted towards medical disciplines), it would get 77% of provincial funding. So Manitoba receives slightly more funding than it would in other provinces, as does – in a relatively more significant way – Brandon University. And Winnipeg does receive less than it would if it were in another province: $18 million less than if Manitoba used Quebec’s formula, and $25 million less than if Ontario’s were used. That’s a big gap, but still less than it would appear just looking at FTEs alone.
Now, on to New Brunswick. One has to be a little careful about making inter-institutional comparisons with CAUBO data in New Brunswick because of the peculiar arrangement between UNB and St. Thomas (STU). Because the two share the former’s campus, the provincial government sends UNB a little bit extra (and STU a little bit less) in order to cover extra costs. So, with that in mind, let’s look at the data:
Figure 2: FTEs, Weighted FTEs, and Actual Funding, New Brunswick Universities
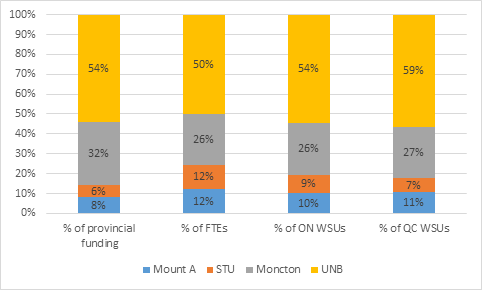
New Brunswick looks a bit different than Manitoba, where the biggest university is overfunded. In New Brunswick, it’s UNB that actually seems to be doing badly, receiving 50% of all money when, in Ontario, it would receive 54%, and in Quebec it would receive 59% (and remember, that 50% is actually inflated a bit because of the money to support STU students). The institution that really seems to be overfunded in New Brunswick is Moncton, which is receiving $13 million more than it would if New Brunswick used either the Quebec or Ontario formulae.
So, yes Virginia, relative underfunding does exist in Manitoba and New Brunswick. This probably wouldn’t be the case if either province ever bothered to put its institutional funding on an empirical footing, via a funding formula. But that would create winners (likely Winnipeg & UNB) and losers (likely Brandon, Moncton and, to a lesser extent, Manitoba). And what politician likes to hear that?


4 Responses
Am I reading the second graph correctly? Looks like UNB actually gets 54% of funding (article says it gets 50%), and has 50% of students. That might change the analysis, suggesting that the ON formula would be spot on for what UNB actually gets from the NB government, but lower than what Quebec would provide.
Thanks for another great topic!
Yes, you;re reading that absolutely correctly.
Alex, did Jacquie allow for the difference between the program-based and activity-based funding models in ON and QC respectively, or treat QC as if it were a program-based model for simplicity’s sake?
The latter. I’m told the difference is not substantial in practice.