


One of the endlessly recurring debates in Canadian higher education concerns whether institutions are properly investing in faculty. It’s never entirely clear what “properly” means – the goalposts move a bit depending on who is talking. Sometimes it’s about faculty hiring lagging behind student enrolment, sometimes it’s faculty not getting their “share” of money coming into universities. The comparator varies, but the ratio is always claimed to be moving in the wrong direction. This blog seeks to examine this claim from as many angles as possible.
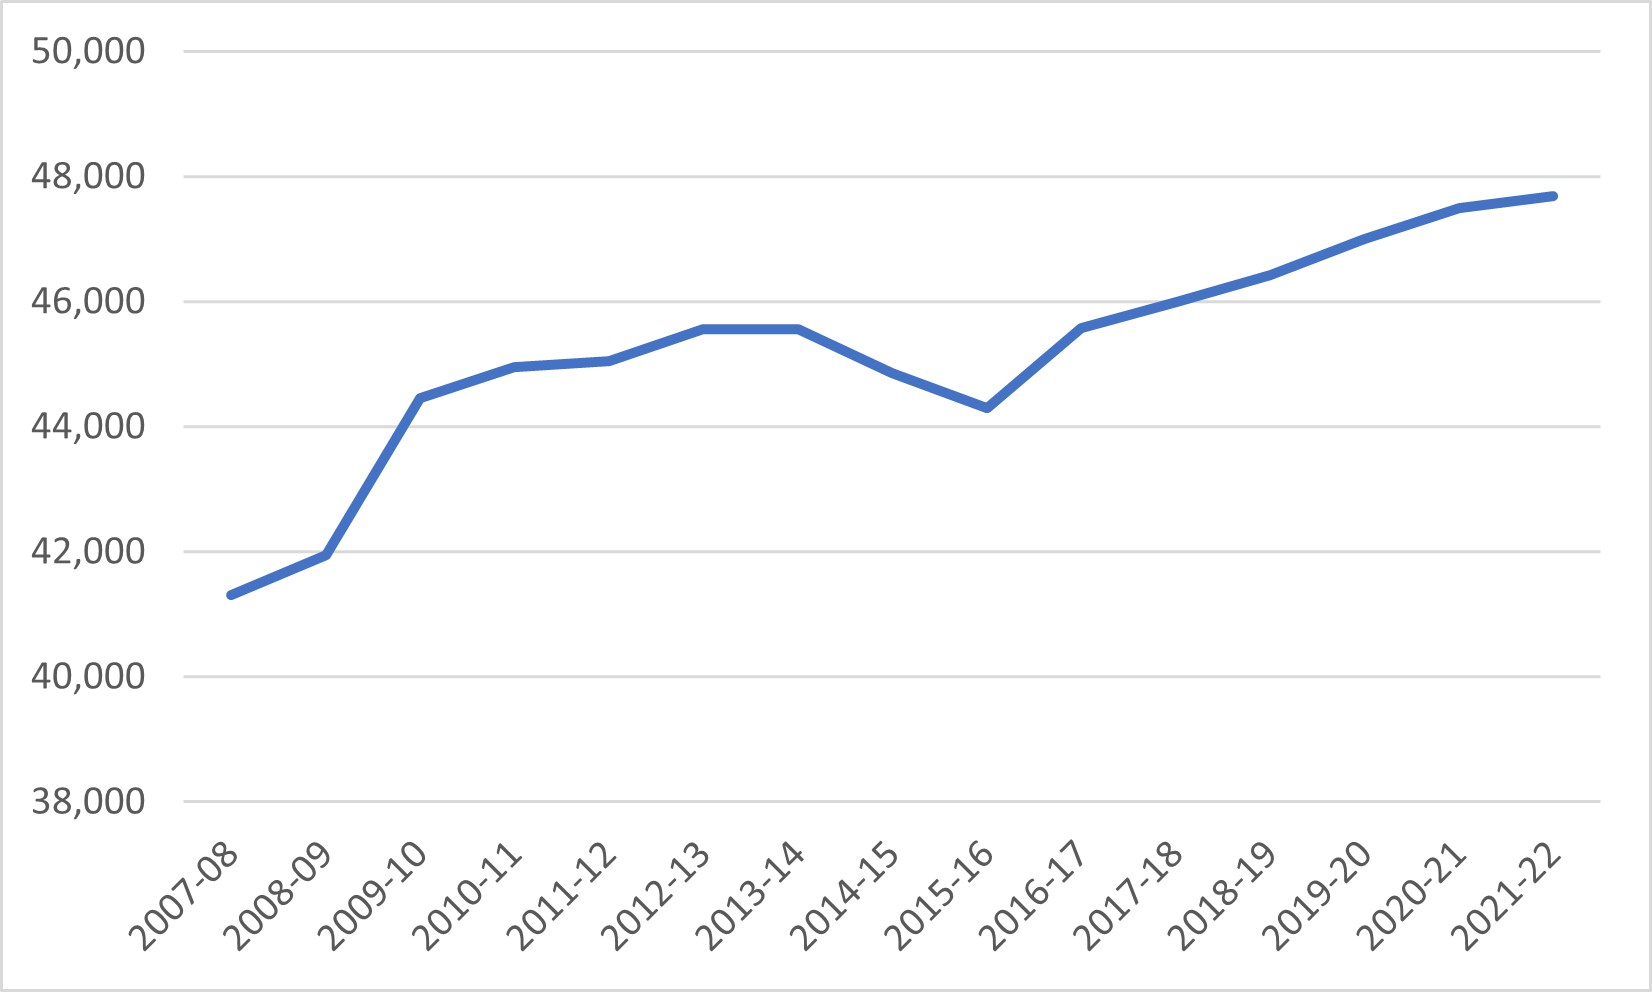
Let’s start by looking at the total number of faculty in Canada. If you’ve been told that this number is stagnant, think again. In fact, since 2007-08, tenured and tenure-track faculty numbers are up 17%, and since 2015-16 have been increasing in net terms by about 500 faculty members per year.
Figure 1: Number of Full-time Tenured and Tenure-Track University Faculty in Canada, 2007-08 to 2021-22
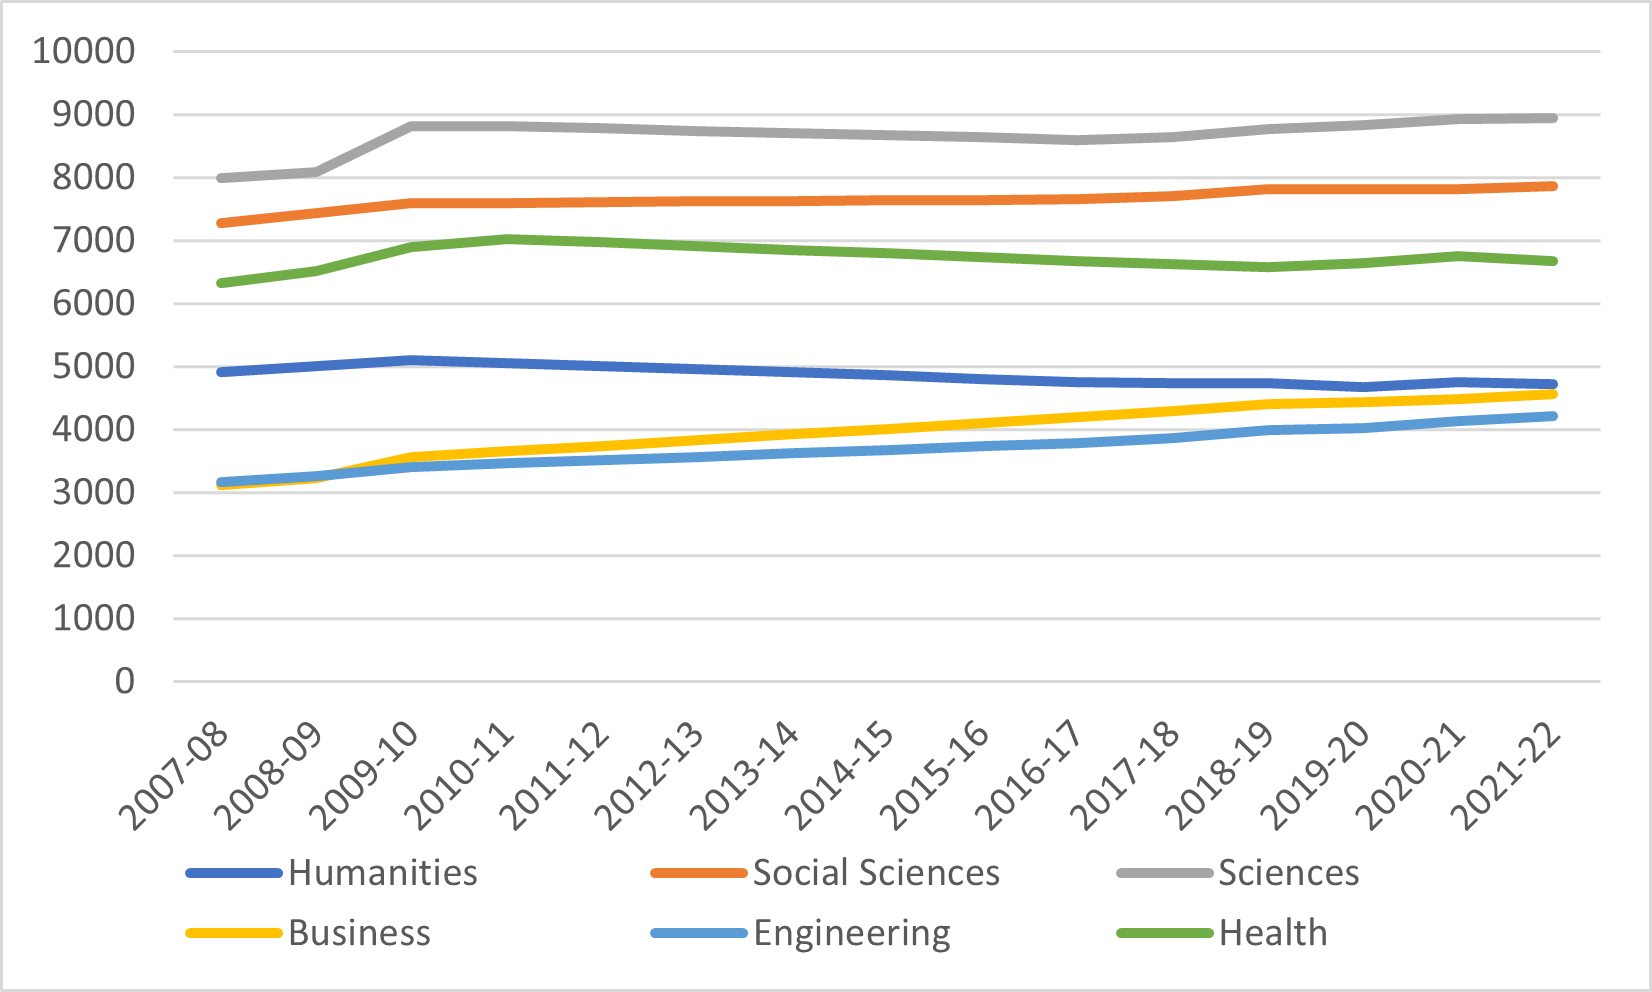
A quick aside, for those who are wondering about fields: figure 2 gives the relevant breakdown. Humanities are down a wee bit – about 5% off their 2009 high, nowhere near the 25% drop in enrolments – and the big growth has been in business and engineering. Intriguingly, the health numbers are off a bit despite a big growth in enrolment, a stat that warrants a bit more investigation.
Figure 2: Number of Full-time Tenured and Tenure-Track University Faculty in Canada, Select Broad Fields of Study, 2007-08 to 2021-22
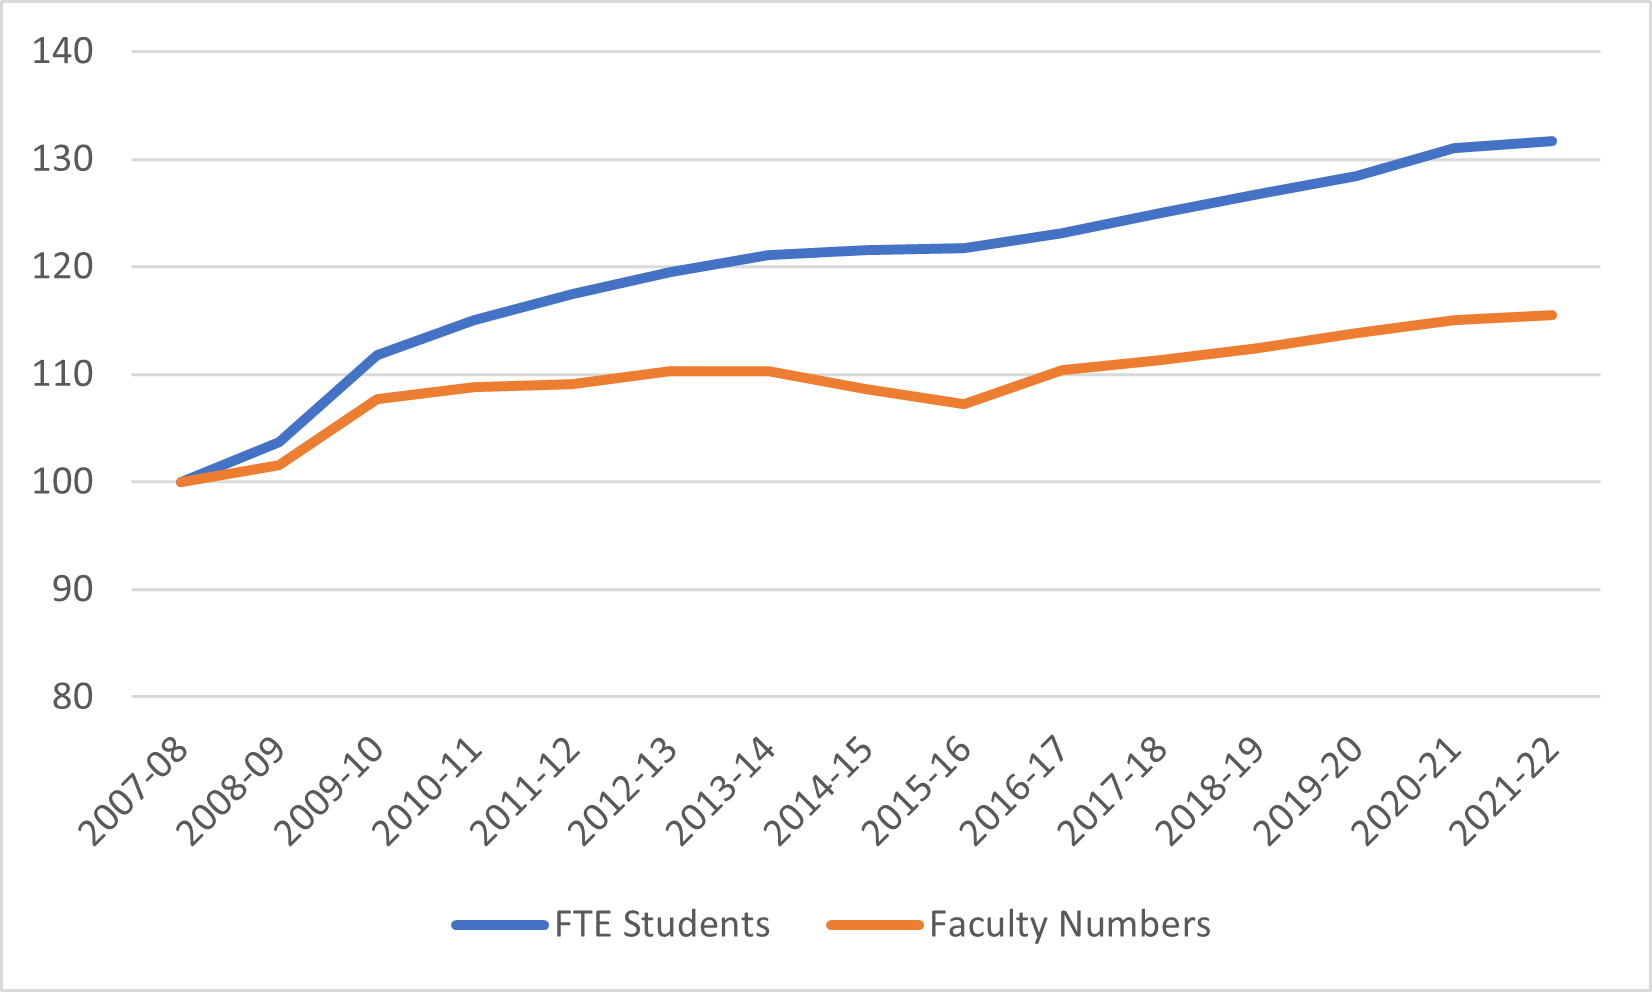
Anyways, if we’re trying to examine the question of whether universities are investing in faculty, the issue is not whether spots in individual disciplines are keeping pace with enrolment but whether academic positions in toto are keeping pace with FTE student enrolments. Figure 3 shows that in fact they are not: since 2007-08, total FTE student numbers are up by about 30% while faculty numbers are up by only 17%. Score one for the underinvestment in faculty argument.
Figure 3: Indexed Change in FTE Students and FT Faculty, Canada, 2007-08 to 2020-21 (2007-08 = 100)
Of course, one might argue that FTE students aren’t the right comparator since it’s not students alone who pay for faculty salaries. Rather, they are paid from operating income, which is a combination of government grants and tuition fees. So, figure 4 makes the same comparison, only replacing FTE students with operating expenditures (in constant dollars) as the comparator.
Figure 4: Indexed Change in Faculty numbers vs. Real Aggregate University Operating Expenditures, Canada, 2007-08 vs. 2021-22 (2007-08=100)

Holy cow! Well, that settles it, doesn’t it? Universities are definitely making money by clamping down on professorial hiring! Not hiring them in proportion either to operating grants or FTE students, and thus deliberately increasing student-professor ratios as a result? What a travesty! 2-0 for the underinvestment argument.
Except, hang on a second. The above comparison works if you just look at academic numbers. What happens if you look at aggregate academic pay? After all, “expenditures” are probably a better indicator of “investment” than headcount. Well, it turns out that if you compare growth in total academic pay to growth FTE student numbers as I do below in figure 5, you see that over the past fifteen years, aggregate pay has grown at essentially the same rate as FTE students. Uh-oh. Appropriate investment levels claw one back! It’s 2-1!
Figure 5: Indexed Change in Aggregate Faculty Wage Expenditures vs FTE Students, Canada, 2007-08 to 2021-22 (2007-08 = 100)

We see something similar when growth in academic wages is compared to growth in constant institutional operating expenditures, as I do in Figure 6. The two are growing at essentially the same rate. Again, this is pretty clear evidence that there is no underinvestment going on. Obviously, it might be nice if operating income was growing faster, because faculty would be getting a similar share of a bigger pie, but there’s no evidence that funds for faculty are being diverted to other uses. 2-2! It’s a draw!
Figure 6: Indexed Change in Aggregate faculty Wage Expenditures vs. Real Aggregate University Operating Expenditures, Canada, 2007-08 to 2021-22 (2007-08 = 100)

There are two takeaways here. The first is that there are two legitimate POVs at work in this issue. Faculty can look at this data and feel that they are being increasingly required to take on larger workloads, while administrations can look at exactly the same data and say that financially speaking, nothing has changed in the past fifteen years with respect to academic hiring. Both are true, but neither is the complete truth.
Which brings us to the second takeaway, which no one wants to hear, and it is this: in a world of constrained budgets, there is a trade-off between faculty salary increases and faculty numbers. You don’t have to like it, but it’s true. And the faster everyone stops ignoring this basic trade-off, the faster we can get to more rational discussions on higher education finance.


2 Responses
It would be interesting to see some similar charts for the cost of administration in the same period. That may be harder to define, however.
This is great, thank you. Question: Fine to update expenditures as $ vs # of Faculty (Fig 4 vs 5), but shouldn’t some version of that also be done for income? Appreciate that this is difficult as it will vary by province, but there’s another part of the answer there, I suspect. Faculty wages have increased with inflation, but tuition in Ontario is frozen, and government grants per FTE are not keeping pace (have they gone up at all?). So have increased enrolments just allowed faculty to withstand an inflation adjusted pay cut, at the expense of new hiring? Maybe it’s not faculty vs admin, but faculty/admin vs the province?