


Sometimes I need a mental break from writing a few hundred words on one topic. So, today, here’s a few hundred words on three separate topics.
1) The Sexuality Gap. A few years ago, Statistics Canada threw a question on sexual orientation into the Canadian Community Health Survey. What this meant was that we suddenly got a lot of demographic data on the country’s LGBTQ+ population, including the finding – published in Ethnocultural diversity among lesbian, gay and bisexual cultures in Canada: an overview of educational and economic outcomes – that: “among the Canadian-born population, aged 25 to 64 years, gay or lesbian people (38.0%) were more likely to hold a bachelor’s degree or higher when compared with their heterosexual counterparts (28.3%). Conversely, a larger share of immigrants held a university degree than their Canadian-born counterparts, regardless of sexual orientation” (Statscan graphic reproduced below)
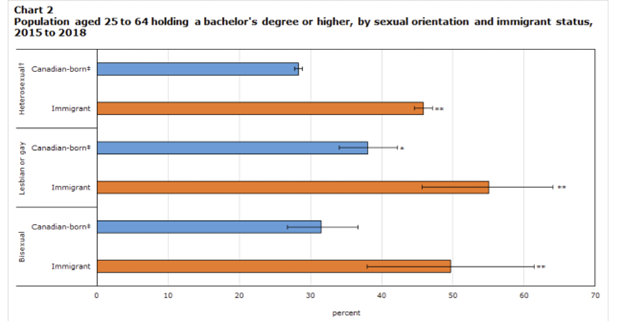
Wow. Ten percentage points is a big gap. What’s causing the correlation between education and sexual orientation?
Well, the answer is pretty mundane. What it comes down to is i) the self-identified lesbian, gay and bisexual population skews a lot younger than the heterosexual population and ii) young people are also a lot more likely to have a degree. Add those two together and that explains pretty much all the difference.
Still: interesting data point!
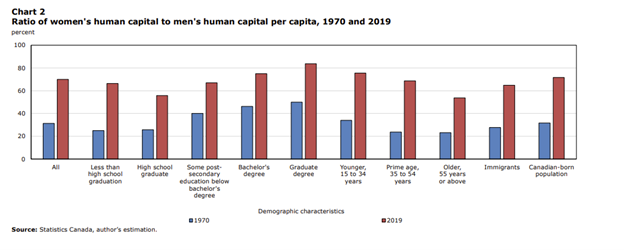
2) Human Capital Over Time: Also last month, Statistics Canada put out a fairly wonky paper called Accumulation of Human Capital in Canada: An Analysis by Gender and the Role of Immigration. I say wonky because human capital is calculated as “the present discounted value of future labour income of individuals over time”. So, in calculating human capital, this method prices in both difference in wages and different propensities to work over the lifetime. This measurement is not looking at education levels or anything like that – it’s just asking questions about lifetime market income.
For me, the report’s key findings include: i) that human capital differences between women and men closed rapidly between 1970 and 1995 before levelling off for a decade or so at a little over 60% of men’s lifetime earnings and then crawling upwards slowly thereafter to the current level of about 70%; ii) that the gap closes with education (see graph below), iii) human capital growth for men has been essentially zero for the past fifty years and for men with education at the bachelor’s level and higher it has actually been negative (though nearly all of that drop seems to have occurred pre-1995, that is, during the period where women were catching up and passing men in terms of degree attainment and thus probably competing away some human capital gains differences which were probably just rent).
3) Graduate Student Finances: We all know that Statistics Canada is limited when it comes to higher education, particularly when it comes to students. It didn’t used to be: twenty years ago, we had not one but two national surveys covering students. Now? None. So, our understanding of student income is pretty much non-existent.
(This is not entirely Stastcan’s fault. It’s ESDC which has stopped paying for survey work. On the other hand, at the rates Stastcan charges for survey work, I’d probably balk, too. Anyways, our data is terrible).
What this means is that if you want to understand anything about Canadian students, you must go out and do the survey yourself, which is hard to do. So, kudos to the Ottawa Science Policy Network for conducting and publishing the Graduate Student Finance Survey which was published in – of all places – Biochemistry and Cell Biology last month.
It’s not what you’d call a really representative sample: it skews heavily towards research degrees rather than professional ones, and more heavily towards students in biomedical faculties than others. And the “n”s on some the breakouts are pretty small. But nevertheless, this survey is particularly good at showing the differences between fields of study in terms of the size and availability of fellowships, as well as where this financial support comes from (supervisors vs. departments). I won’t go so far as to say there is anything particularly surprising in the report – except perhaps how many graduate students think their financial situation is comfortable (9%) or “enough” (47%) – but there is lots of good data here that should make everyone think about how well we are doing by graduate students in this country. It deserves a wide readership.

