


For the last few years, Statscan has been publishing cohort completion data using the Post-Secondary Student Information System (PSIS). A new round of data dropped last week, and there were several interesting nuggets for anyone who cared to dive in a little bit behind the headline numbers. Let’s dive in, shall we?
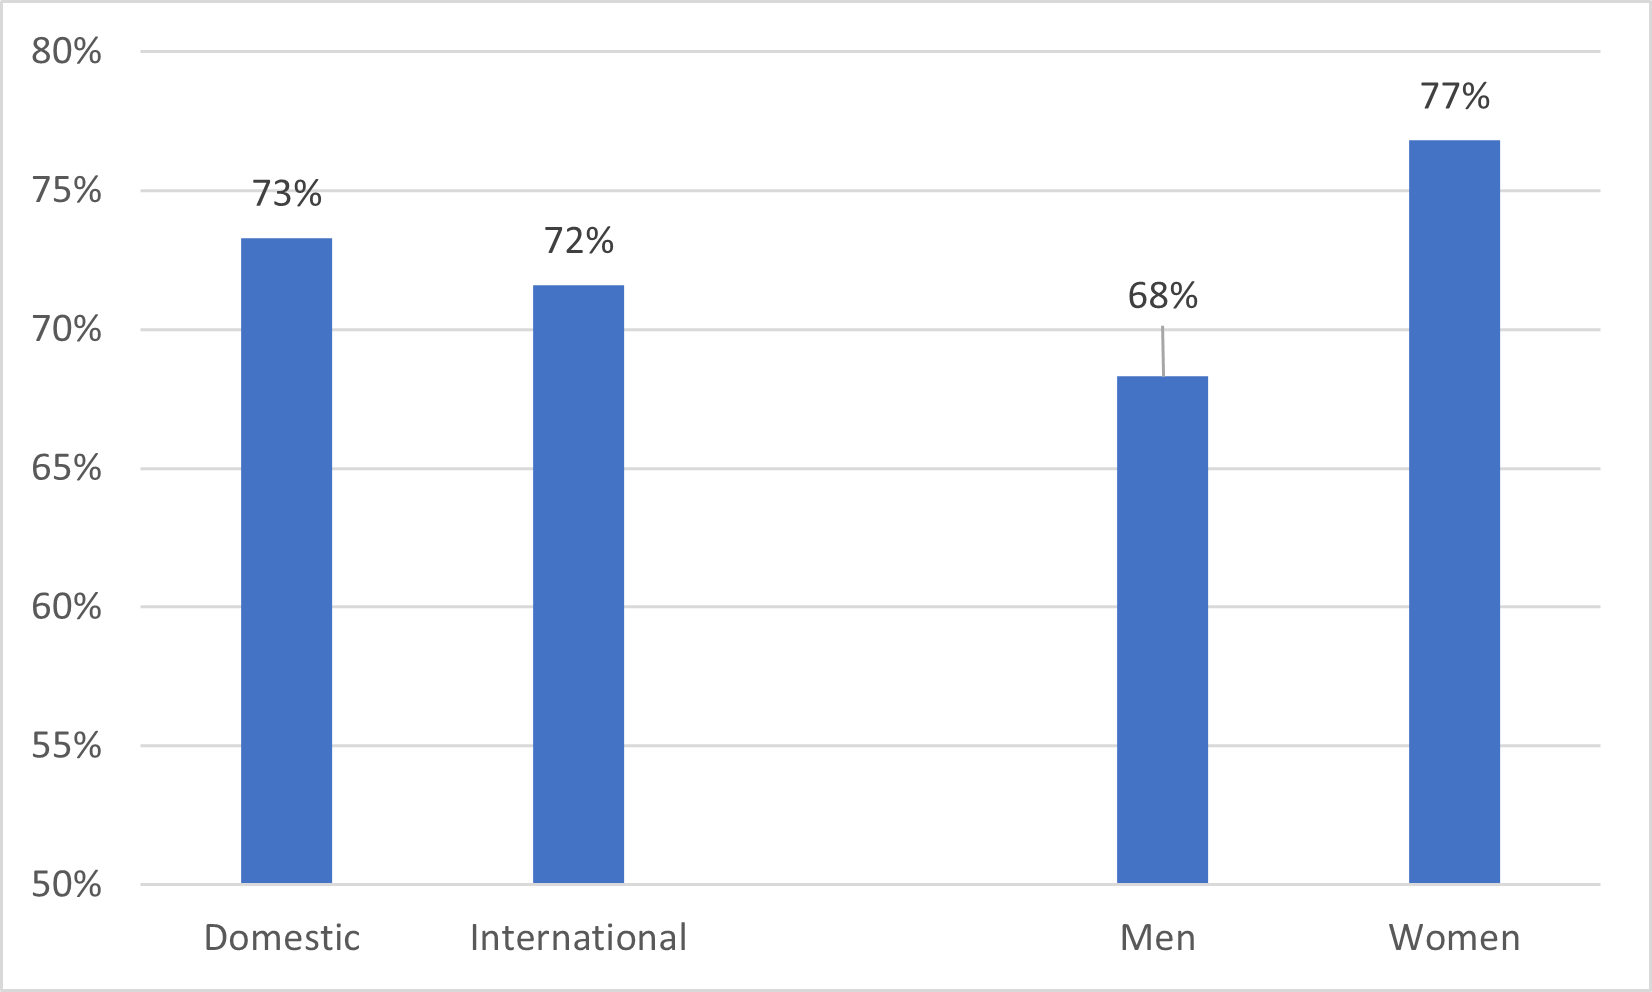
Let’s begin with university undergraduate degrees. Figure 1 shows the 6-year completion rate for undergraduate degrees in Canada (note, completion here refers to completion of the degree-level in which the student is first enrolled, so a student who starts in a university program and switched to a college program which they completed with six years is still considered a non-completer in this data). The latest year for which we have data is the 2014-15 entering cohort, but the data looks pretty similar going all the way back to 2010 – this isn’t an indicator which moves very much from one year to another. In total, roughly 73% of all students who start undergraduate programs complete within six years, and while there isn’t much difference between domestic and international students on this score, there is a pretty significant (almost 10 percentage points) one when it comes to gender.
Figure 1: Six-year Completion rate for University Undergraduates, Most Recent Year (2014-15 entering cohort)
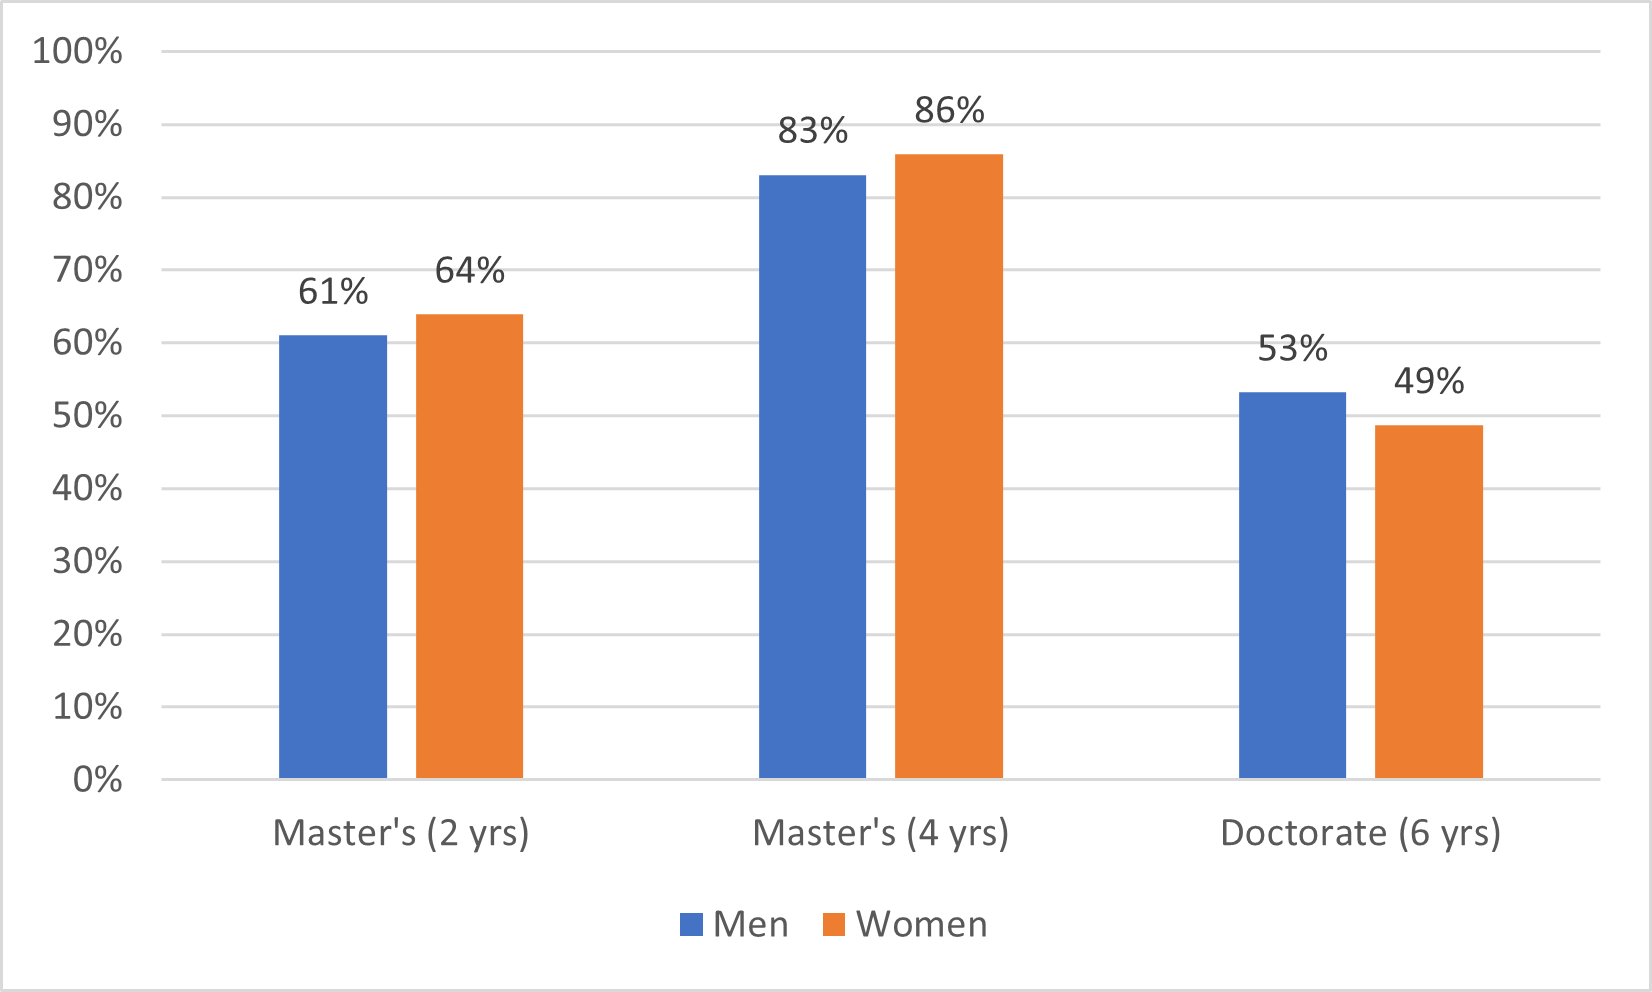
Of more interest is the data on graduate student completion rates. On average it seems to take a little over 2.2 years to finish a master’s degree: a little under two-thirds of students actually seem to finish it in that amount of time and another 20% or so seem to go on to finish it within four years. As with undergraduate degrees, there is a gender gap with women tending to graduate at a slightly higher rate than men, but it is much smaller than at the undergraduate level. At the doctoral level, it is a different story. Here, 6-year graduation rates are just over 50% with an average time to completion of (among those who graduate in under six years – unfortunately this dataset doesn’t go past six years) just under 5 years, but the gender gap runs the other way; that is to say men graduate at a slightly higher rate than women.
Figure 2: Four and Six-year Completion rates for Graduate Degrees, Most Recent Year (2014-15 and 2016-17 entering cohorts)
I know figure 2 is going to get a lot of people asking about differences by field of study, and the answer to all of these questions is “sorry, the public dataset doesn’t have contain field of study data”. However, the actual full dataset does have that information. So, for the folks involved in graduate studies, if ever you want to start doing regular national analyses by field of study (hi there, CAGS!), Statscan has the data, it will just take some dollars to unlock it.
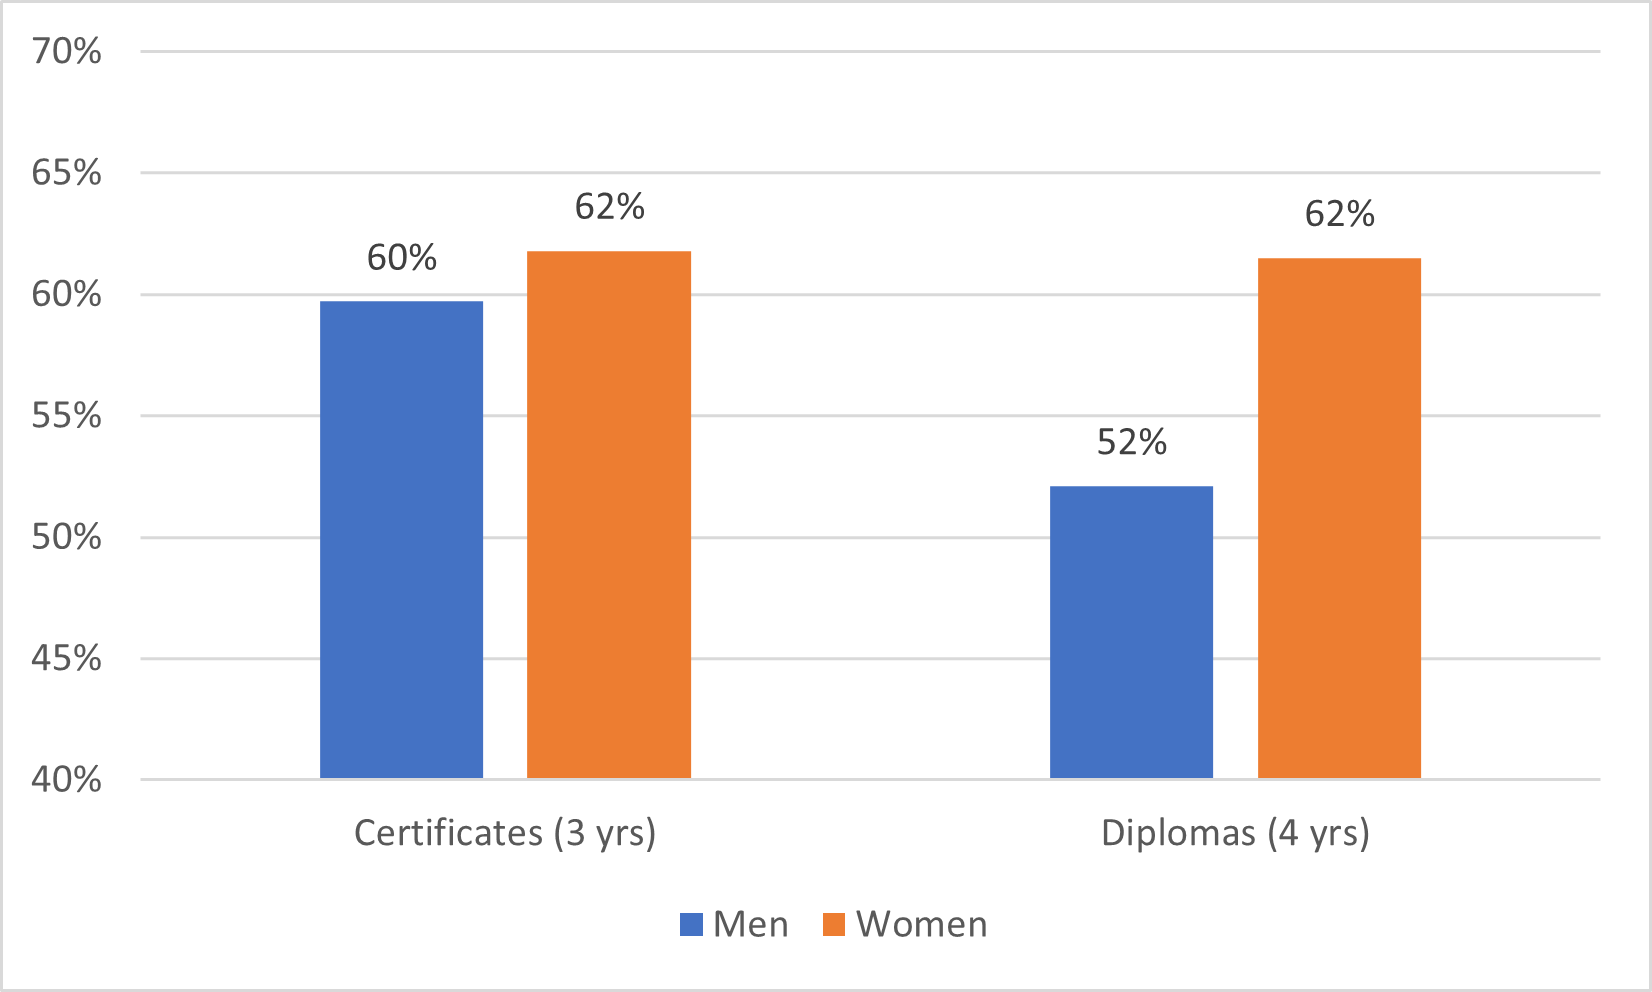
Anyways, on to colleges. Here we can look separately at rates for certificates, which in principle are mostly 1-year programs, and for diplomas (either 2- or 3-years depending on the province) and their completion rates after 3 and 4 -years, respectively. These are not necessarily the best ways to measure completion, but Statscan doesn’t let you tailor these measures at will. Completion rates in one-year programs are a little over 60%, and the average time-to-completion of those who complete within three years is about 1.2 years (meaning that those who complete mainly complete on time), while only about 58% of those in diploma programs graduate from them within four years. There is a significant gender gap on diploma programs but not on certificate programs.
Figure 3: Three and Four-year Completion rates for College Diplomas and Certificates, Most Recent Year (2016-17 and 2017-18 entering cohorts)
So, are these figures good or bad? It’s hard to say. For undergraduate students, the completion rate is about 8 percentage points higher than at four-year institutions in the United States, but the definitions of completion in the two countries are somewhat different: in the US, “completion” means “completion of a bachelor’s at the institution where the degree was started” whereas in Canada, it means “completion of a bachelor’s degree anywhere”, so one would expect a higher rate calculated rate up here. One thing to note is that completion rates, at least for those credentials where the Statscan sample is relatively consistent over time (true for all of them except certificates), seem to be pretty stable, neither deteriorating nor improving.
Maybe we should expect incremental improvement over time, though? But that would probably require some kind of accountability system and since I am reliably informed that accountability for outcomes is deeply injurious to the entire idea of academic freedom and being a university, the chances of this are pretty much zero.
But good to know Statscan’s PSIS is finally producing good data on this stuff. It’s needed.

