


Yesterday, I began outlining how the Nova Scotia government is trying to measure university program costs, and got as far as working out how the scheme was capturing certain facts about program income (excluding government grants and fees of students yet to declare a program) and certain facts about expenditures (excluding infrastructure, student services, IT, and roughly 60% of tenured professors’ salaries and benefits) and considered various ways that some assumptions about how to distribute both costs and revenues were likely to systematically slant the results for or against certain types of programs.
Now comes what you would think is the easy part – putting program costs per credit hour and program revenues per credit hour together to come up with a net program cost program hour. Like if costs are $300/credit hour and revenues are $350/credit hour, then this program has positive net gain of $50/credit hour, right? Right?
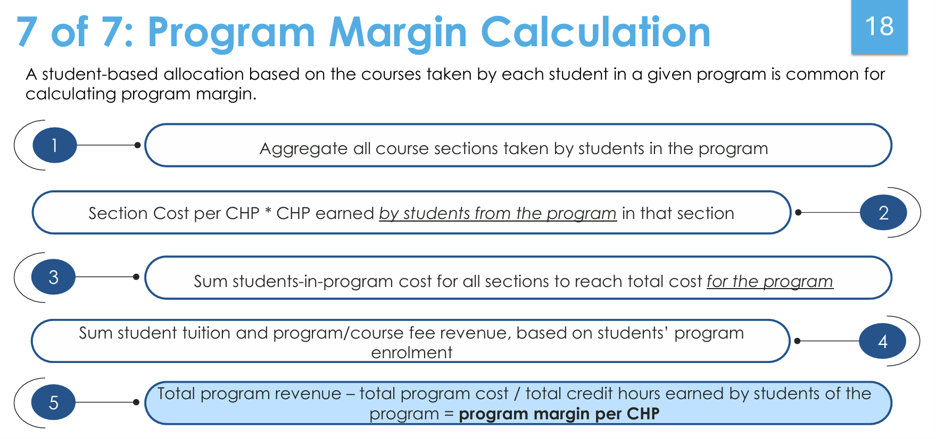
Well, no. For reasons which defy easy explanation, this is not the way Nova Scotia and their consultants are choosing to do things. Here’s what they are doing instead (if you can’t read the image below, it’s on page 18 of the document here). Come back tomorrow for the exciting conclusion.
I will try to explain this the best I can because it’s very odd.
Basically, there are two ways to calculate program income: you can calculate it based how many students declare the program to be their major, or you can calculate it based on the number of credit hours taught. Similarly, you can either calculate costs based on the costs of students who declare a particular major (regardless of which department puts on the courses) or based on the actual costs of putting on the program. One set of choices is based on student activity, and the other is based on actual program/departmental activity.
Both of these approaches are acceptable. What shouldn’t be acceptable, though is choosing one method to calculate costs and the other to calculate income, which is what the province of Nova Scotia has asked its institutions to do. That’s not just a mishmash; it’s a mishmash that has a very specific and predictable outcome. Which is, basically, to make programs belonging to departments with a large service component – that is, ones that teach lots of students but don’t necessarily have a lot of majors (think English, for instance, or modern languages) – look a lot worse than they otherwise would because it effectively assumes they do not actually generate very much income.
Why would the Nova Scotia government do this? Well, the conspiratorial answer would go something like this: the Houston government, like many conservative governments these days, seems to be pretty utilitarian when it comes to higher education. It seems to believe that degrees should be tightly linked to careers, and therefore things that help universities offer “breadth” are ipso facto a waste of money. Since the entire point of this exercise is to “discover” areas where universities are losing money, this methodology fits pretty nicely with that point of view.
The non-conspiratorial version of this is that the government of Nova Scotia simply doesn’t understand what it is doing and is being led by the nose by a company from a country where grant income from state governments is classified as “non-operating” income – the exact opposite of here, of course.
I hope that the picture I have built up so far is this: the Nova Scotia costing exercise involves a lot of methodological choices. None of the individual methodological choices are necessarily wrong, but neither do they collectively hold up as being especially coherent. And it is evident that whatever the exercise produces are going to be shaped at least as much – if not more – by the methodological choices that went into the design as they are by any underlying reality.
And look, it’s not a crazy idea that institutions should understand their cost structures. However, if you’re going to go down this route, and choose a complicated methodology to measure said structures, at least have the intellectual honesty to allow figures to be calculated concurrently using different methodologies. If a program looks expensive using several different methodologies, then it’s probably expensive. But if it looks cheap in some and expensive in others – which I suspect would be the case as often as not given the choices made – then maybe there you have some more thinking to do.
The last thing I hope you all have noticed about this exercise is that is bananas complicated to complete, requiring institutions to be able to manipulate data in ways that many simply can’t do without a lot of extra programming effort (being able to link individual student files across individual class section modules which are linked to individual professorial salary files…this simply isn’t something most institutions do as a matter of course). Putting this work therefore cost institutions tens or even hundreds of thousands of dollars of effort each. Huron – the company whose over-elaborated methodology caused this problem – did offer to make amends…by suggesting colleges having difficulty following its methodology might want to pay them (Huron) directly todo the work on their behalf, which might be the least ethical thing I’ve ever seen a higher education consulting company do. I have a copy of the email if anyone wants it.
And moreover, this level of detail is unnecessary. As I said yesterday, if all you’re trying to do is work out which areas of the university are not paying for themselves, there are far simpler methodologies available. This level of detail might look impressive, but the precision it delivers is debatable, and quite possibly spurious. Between the exclusions of income, the exclusions of expenditures and the different bases on which cost per credit hour and revenue per credit hour are calculated, it’s just not clear what kind of relationship these numbers have to reality.
God help anyone trying to turn this data mess into policy. If the Nova Scotia government starts trying to kill programs on data this tendentious, it’s going to get ugly.

