




Just a short one today, based on some data from the OECD in its annual Education at a Glance Report which was released last week. I won’t do a full report, as many of the post-secondary indicators are banal and predictable (Canada does well at churning out post-secondary graduates, etc., etc.). But the report does contain one intriguing set of new tables: for the first time (AFAIK), the OECD has gathered data that, in theory at least, allow for international comparisons with respect to how universities spend their money. It all seems a bit experimental, but it’s certainly worth a blog.
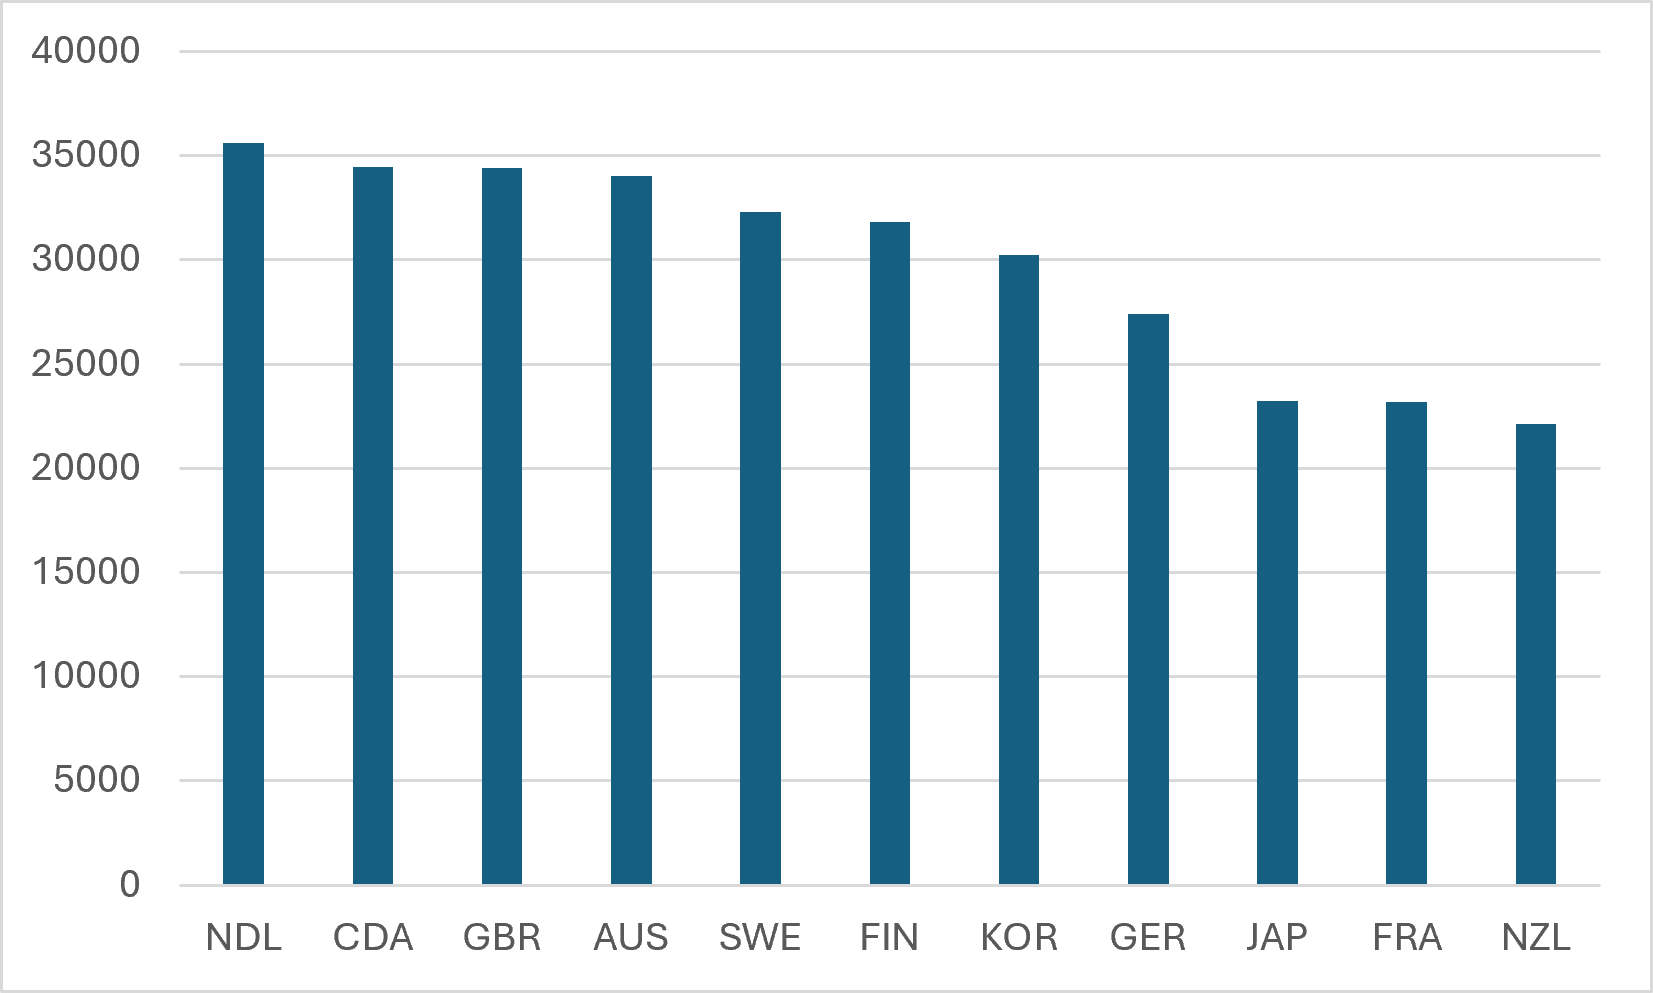
Let’s start with Figure 1, which shows the amount spent by public institutions per full-time equivalent student, in USD at PPP. The US, unfortunately, did not provide data for this indicator, which means the figure is missing wat is probably the most interesting comparator. But what it shows is that institutions in a large number of OECD countries (the Netherlands, Canada, Great Britain, Australia Finland and Korea) are actually spending very similar amounts of money – between $30-35K – on a per-student basis, while other countries in the sample, like Japan, France and New Zealand, are spending considerably less. It should be noted though that this is actually not quite a fair comparison in that the Netherlands and Finland educate a substantial proportion of their bachelor’s degree students at universities of applied science, which appear not to be considered “public” in these figures, while Germany, France, Japan and Korea all educate substantial proportions of their students in private universities (15%, 27%, 75% and 80%, respectively) which means that the overall cost per student in these countries is substantially less than indicated in this chart. If we were looking at expenditures per student spread across all institutions, Canada would come first.
Figure 1: Expenditures Per Full-time Students at Public Universities, Select OECD Countries, in USD, at PPP, 2023
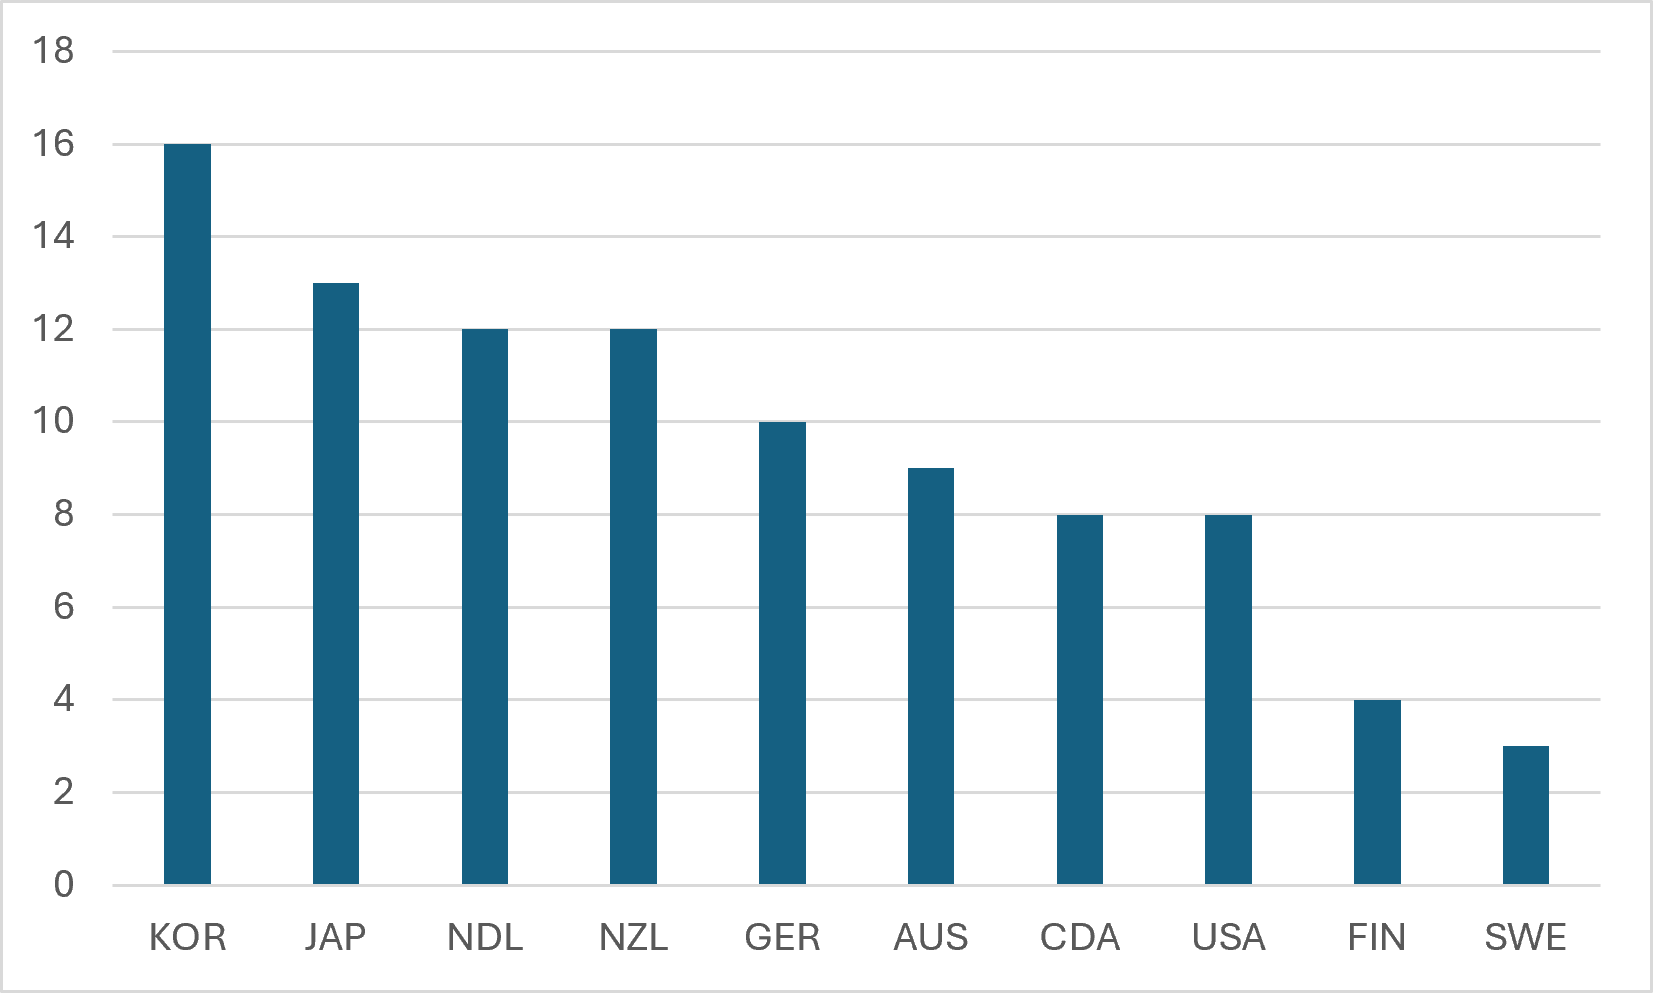
Another interesting data point the OECD provides here is with respect to the amount of money institutions spend on capital as opposed to “current” expenditures. In the popular imagination, anglophone universities chasing international students spend wildly on buildings to the detriment of other things like salaries. But as Figure 2 shows, that doesn’t seem to be the case. The two Asian countries on this list – Korea and Japan – actually top the list, while Canada, Australia, and the United States are all somewhat below the mean on this measure, with only about 8-9% of their institutional expenditures being devoted to capital. (It’s not 100% clear to me that all countries define “capital” the same way – the bunching of Asian countries at one end and Scandinavian ones at the other suggests to me that this may not be apples-to-apples, but hey, if the OECD is calling it a data point, so will I.)
Figure 2: Percentage of Total University Expenditures Devoted to Capital, selected OECD Countries, 2023
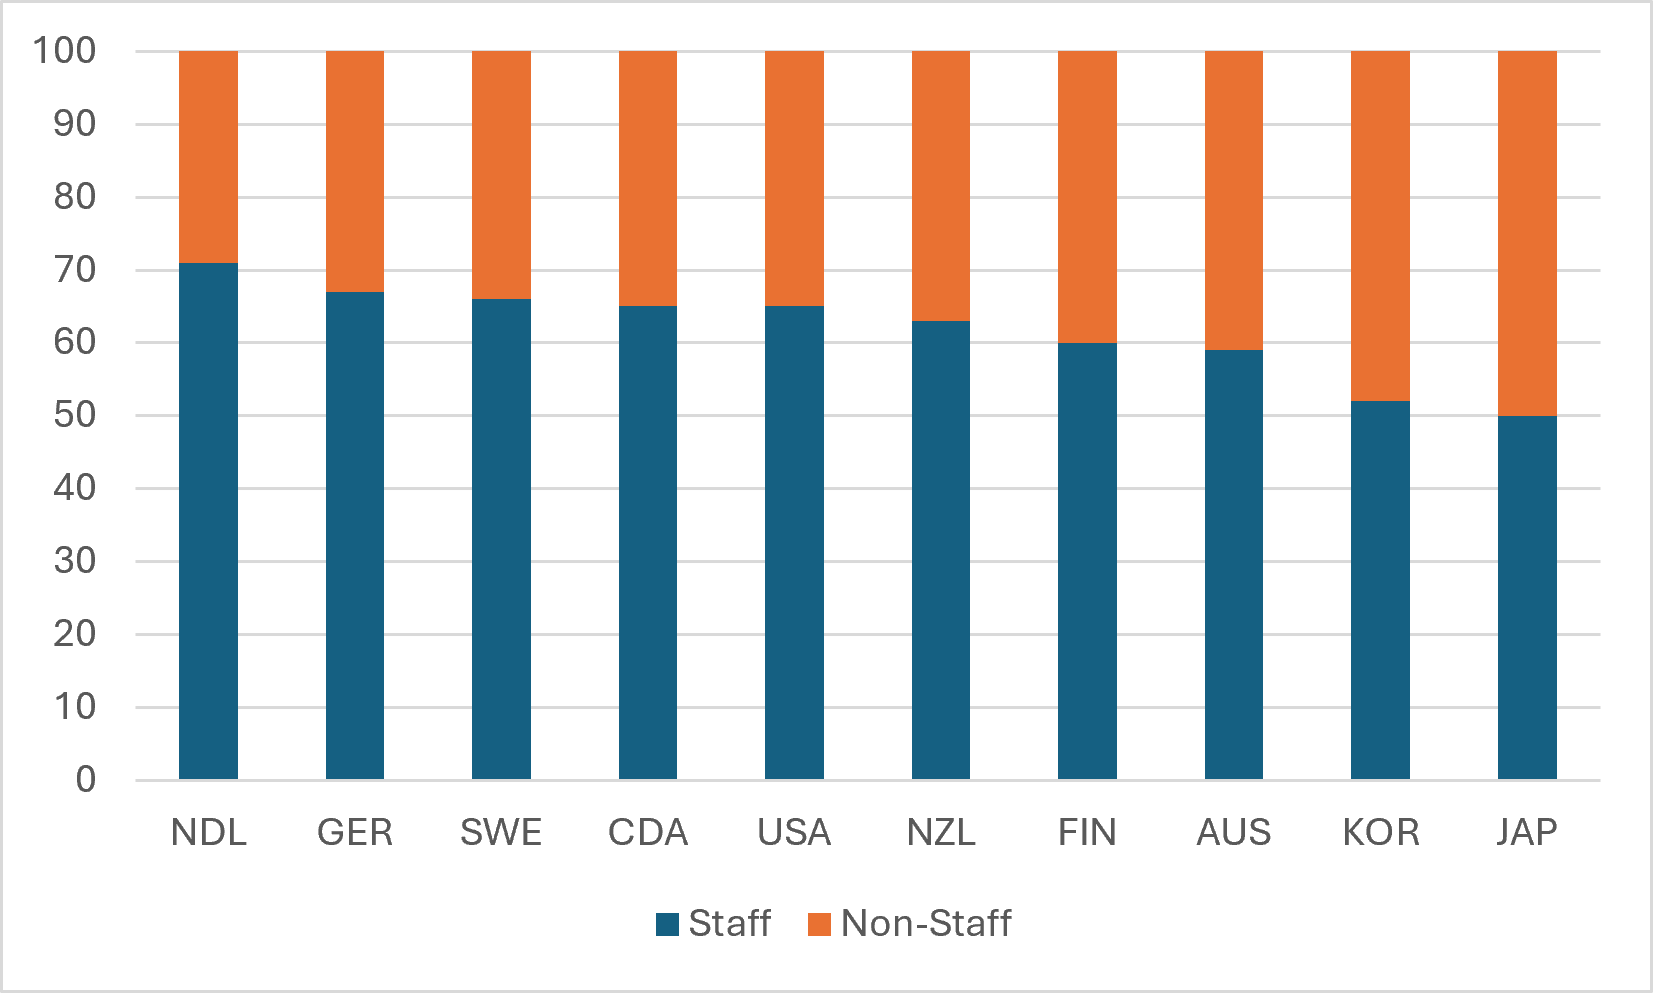
Education at a Glance also provides a breakdown of current expenditures (i.e. excluding capital) into staff costs (that is, total compensation) and “all other expenditures”. I present this breakdown below in Figure 3. Korea and Japan seem to split their expenditures about 50-50 between salaries and non-salary expenditures; in most other countries, the split between compensation and other expenditures is somewhere between 60-40 and 70-30. Canada is slightly higher than average here, but the gap isn’t very large.
Figure 3: Division Between University Staff Costs and Non-staff Costs, Selected OCD Countries, 2023
And finally, for a very few countries, the OECD presents the staff expenditure breakdown by type of staff – that is, teaching staff vs non-teaching staff. Unfortunately, a lot of the countries that Canada usually thinks of as comparators did not provide the relevant data, so the countries in figure 4 are somewhat different from the countries in figures 2 and 3. But the data is intriguing, nonetheless.
Figure 4: University Teaching Staff Costs as a percentage of Total Salary Costs, Selected OCD Countries, 2023
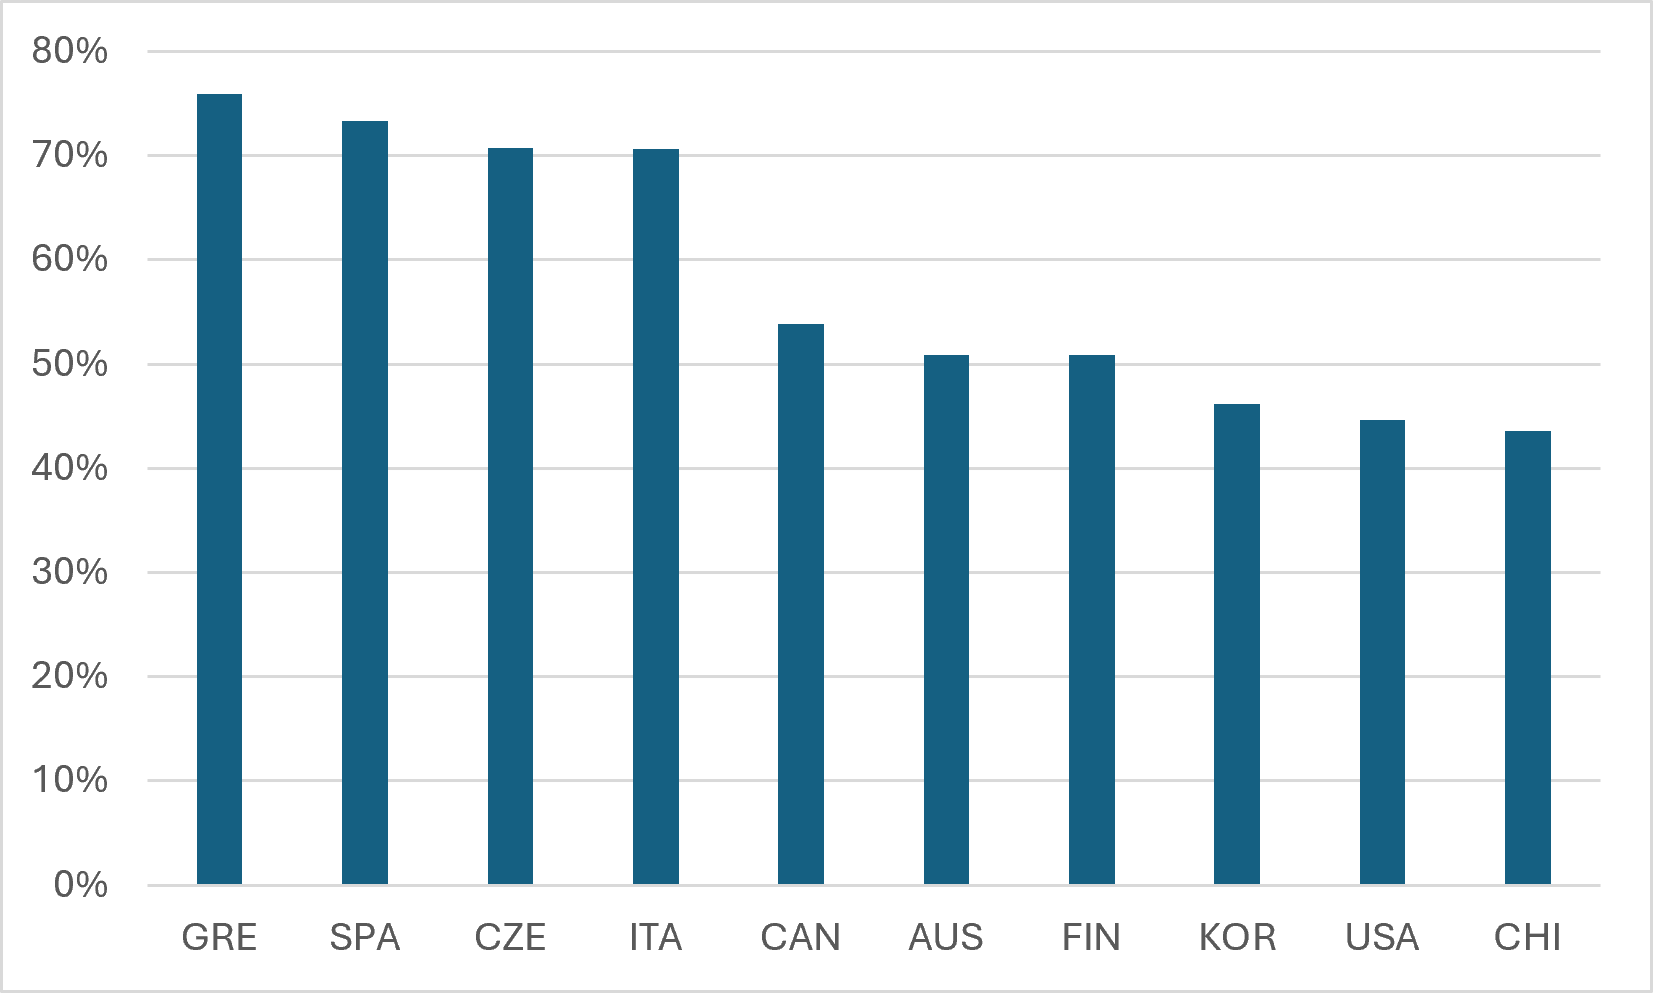
Some of these were probably fairly predictable: central and southern European universities tend to be underfunded and not contain a lot of things like student services or research staff, so it would make sense that teaching staff would occupy a very large proportion of the total compensation budget, as it clearly does in Greece, Spain, Czechia, and Italy. But you’d think the same would also be true of Chile, and yet its universities spend the least proportion of their wages on academic staff. The United States is about where you might expect it to be, given all the discourse about “administrative bloat”, but its proportions are almost indistinguishable from Korea, where universities appear – at least from the outside – to be substantially more parsimonious. In any event, Canada again is about middle-of-the-pack on this measure, not an international outlier by any means.
I am not sure there is anything earth-shattering in any of this. I don’t see any easy generalizations emerging from this data. But a) it’s nice to know that the data is out there and might one day be detailed enough to permit more thorough investigations, and b) everyone can rest easy knowing that Canada is among the world’s top spenders on higher education on a per-student basis and also is not an outlier with respect to spending on capital or non-academic compensation.