


If you pay attention to higher education news from around the anglosphere, you may be under the impression that we are “all in it together”: that is, all suffering, in particular, from the loss of international student funding because of a variety of government policies discouraging them. But is it true?
Well, no. We are not all in it together. Canada – thanks to the galactic incompetence of the federal government in general, and former immigration Marc Miller in particular – is much worse off than everyone else. Let me explain.
In order to compare crises, you have to come up with some common metrics, which is tough to do. Here in Canada, we have three ways of measuring flows of international students. One is through enrolments (institutional reporting to Statistics Canada), the second is new visas issued (courtesy of Immigration, Refugees and Citizenship Canada), and the third is new students arrived (also from IRCC). These numbers evidently don’t line up well with each other. It’s a similar story in other countries. The UK also counts both enrolments and visas, Australia has three separate counts of student enrolments plus visa data. The US has an annual survey of enrolments (by the International Institute of Education, not the government) plus a couple of different measures of visas (one from the State Department and the other from Homeland Security). And, of course, none of the dates line up completely. Some are calendar year, some are fiscal years (which of course also differ from one place to another), some are academic year. And, just to throw another curve ball into the mix, some sources include only new visa issuances, while others combine new issuances with visa renewals.
After a bit of to-ing and fro-ing, I eventually settled on a measure which is more or less common for all four countries: that is, all new visas issues (including renewals), on a calendar-year basis. For Canada, this undersells the nature of the current disaster, because purely new visas are off by much more than visas plus renewals. But consistency is important, so just hold it in your head that Canada is in some respects much worse than figure 1 shows.
Figure 1: Changes in Study Permits Issued, Selected Anglosphere countries, 2019-2025
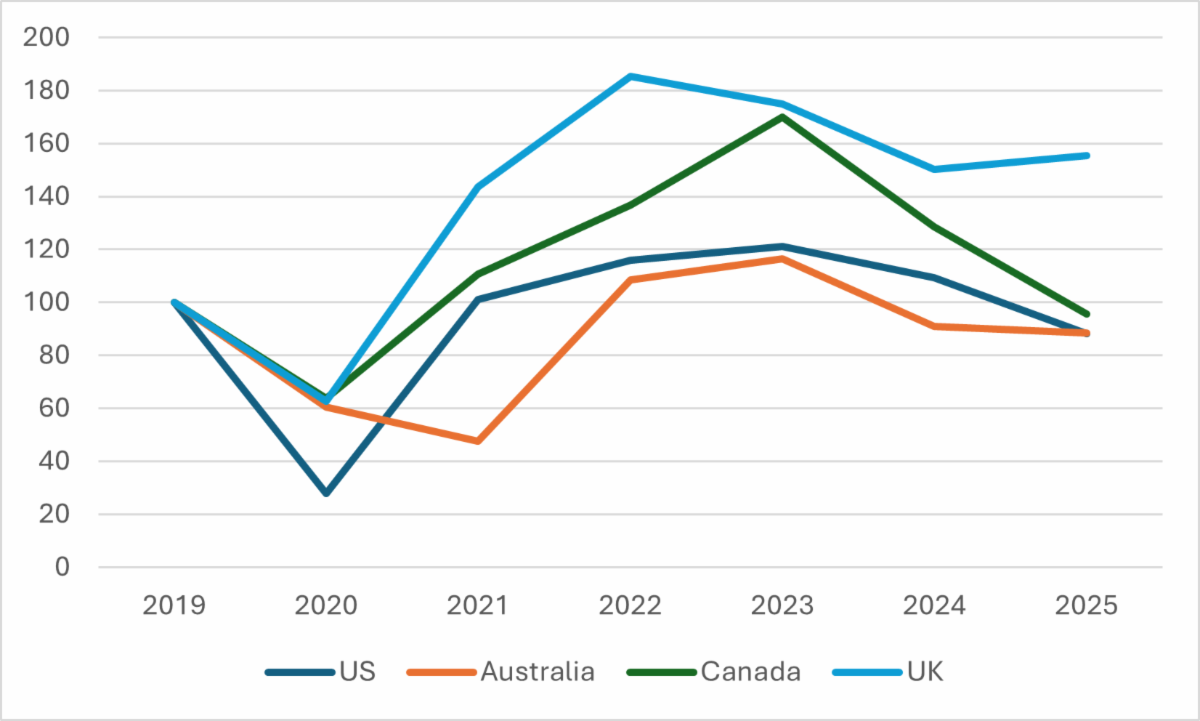
What figure 1 shows is the following:
- All countries saw a steep decline in student vias issued in 2020 due to COVID. In Canada, the UK and Australia the fall was about 35-40%; in the US it was about 70%, in part because of extra rules imposed by President Great Pumpkin.
- The US, the UK, and Canada all bounced back to at least pre-COVID levels in 2021. The exception was Australia because the country was still under quarantine when the 2021 year started.
- If you thought the Canadian boom was bananas, the UK boom was even bigger: 80% above pre-COVID levels by 2022! Since then, number have cooled off slightly.
- Neither Australia nor the US ever had anything you could call a post-COVID “boom”. Numbers in both countries rose to about 20% above pre-2019 levels, and then began falling thereafter (note that American numbers appear to have started their return to earth before Biden left office).
- Canada’s drop of 44% between 2023 and 2025 is by far the biggest post-covid loss of any country. America’s number of visas issued in 2025 was 32% it’s 2023 high, Australia’s was down 24%, and the UK was down just 16% from its 2022 high.
It gets worse: our numbers for January 2026 are 40% behind where they were in January 2025, which implies our three-year fall might be in the range of 66%. And, of course, this is new visas and visa extensions combined, so drop in the number of pure new interests is almost certainly worse.
Of course, it did not have to be this way. There were many ways of reducing student visa numbers without the Minister running around and shit-talking Canadian institutions, thus damaging their brand in the eyes of the world. But Marc Miller and the Liberals’ calculation was that if shit-talking institutions meant another Liberal government, then that was worth whatever disasters and catastrophes the loss of billions of dollars to the country’s post-secondary might cause.
Anyways, the broader point is that there are some similarities to the journeys these four countries: a dip in 2020 followed by a fast rebound and then, after 2023, decline. But while all four share a sine wave pathway, the amplitudes of the curves differ quite a bit from one county to another, and Canada’s is the largest. Similar paths, perhaps, but ours is the most volatile and dangerous.
Thanks, Minister Miller!

