


Statscan put out a very important little paper on access to post-secondary education on Monday. It got almost zero coverage despite conclusively putting to bed a number of myths about fees and participation, so I’m going to rectify that by explaining it to y’all in minute detail.
To understand this piece, you need to know something about a neat little Statscan tool called the Longitudinal Administrative Database (LAD). Every time someone files an income tax form for the first time, LAD randomly selects one in five of them and follows them for their entire lifetime. If at the time someone first files a tax return they have the same address as someone who is already in the LAD (and who is the right age to have a kid submitting a tax form for the first time), one can make a link between a parent and child. In other words, for roughly 4% of the population, LAD has data on both the individual and the parent, which allows some intergenerational analysis. Now, because we have tax credits for post-secondary education (PSE), tax data allows us to know who went to post-secondary education and who did not (it can’t tell us what type of institution they attended, but we know that they did attend PSE). And with LAD’s backward link to parents, it means we can measure attendance by parental income.
Got that? Good. Let’s begin.
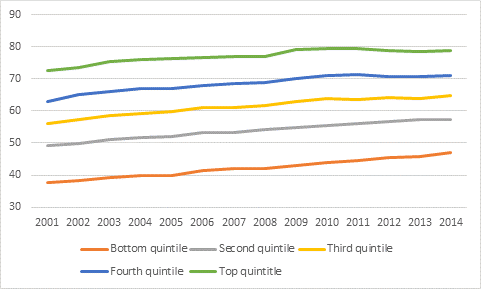
The paper starts by looking at national trends in PSE participation (i.e. university and college combined) amongst 19 year-olds since 2001, by family income quintile. Nationally, participation rates rose by just over 20%, from 52.6% to 63.8%. They also rose for every quintile. Even for youth the lowest income quintile, participation is now very close to 50%.
Figure 1: PSE enrolment rates by Income Quintile, Canada 2001-2014
This positive national story about rates by income quintile is somewhat offset by a more complex set of results for participation rates by region. In the 6 eastern provinces, participation rate rose on average by 13.6 percentage points; in the four western provinces, it rose by just 2.8 percentage points (and in Saskatchewan it actually fell slightly). The easy answer here is that it’s about the resource boom, but if that were the case, you’d expect to see a similar pattern in Newfoundland, and a difference within the west between Manitoba and the others. In fact, neither is true: Manitoba is slightly below the western average and Newfoundland had the country’s highest PSE participation growth rate.
Figure 2: PSE Participation rates by region, 2002-2014
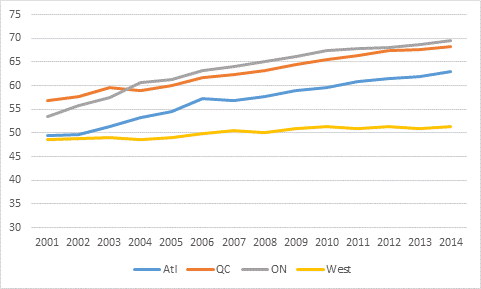
(actually, my favourite part of figure 2 is data showing that 19 year-old Quebecers – who mostly attend free CEGEPs, have a lower part rate than 19 year-old Ontarians who pay significant fees, albeit with benefit of a good student aid system.)
But maybe the most interesting data here is with respect to the closing of the gap between the top and bottom income quintile. Figure 3 shows the ratio of participation rates of students from the bottom quintile (Q1) to those from the top quintile (Q5), indexed to the ratio as it existed in 2001, for Canada and selected provinces. So a larger number means Q1 students are becoming more likely to attend PSE relative to Q5s and a smaller number means they are becoming less likely. Nationally, the gap has narrowed by about 15%, but the interesting story is actually at the provincial level.
Figure 3: Ratio of Q1 participation rates to Q5 participation rates, Canada and selected provinces, 2001-2014
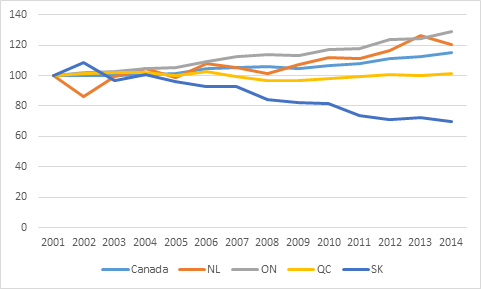
At the top end, what we find is that Newfoundland and Ontario are the provinces where the gap between rich and poor has narrowed the most. Given that one of these provinces has the country’s highest tuition and the other the lowest, I think we can safely rule out tuition, on its own, as a plausible independent variable (especially as Quebec, the country’s other low-tuition province, posted no change over the period in question). At the bottom end, we have the very puzzling case of Saskatchewan, where inequality appears to have got drastically worse over the past decade or so. And again, though it’s tempting to reach for a resource boom explanation, nothing similar happened in Alberta so that’s not an obvious culprit.
Anyways, here’s why this work is important. For decades, the usual suspects (the Canadian Federation of Students, the Canadian Center for Policy Alternatives) have blazed with self-righteousness about the effects of higher tuition and higher debts (debt actually hasn’t increased that much in real terms since 2000, but whatever). But it turns out there are no such effects. Over a decade of tuition continuing to increase slowly and average debts among those who borrow of over $25,000 and it turns out not only did participation rates increase, but participation rates of the poorest quintile rose fastest of all.
And – here’s the kicker – different provincial strategies on tuition appear to have had diddly-squat to do with it. So the entire argument the so-called progressives make in favour of lower tuition is simply out the window. That doesn’t mean they will change their position, of course. They will continue to talk about the need to eliminate student debt because it is creating inequality (it’s actually the reverse, but whatever). But of course, this make the free-tuition position even sillier. If the problem is simply student debt, then why advocate a policy in which over half your dollars go to people who have no debt?
It’s the Ontario result in particular that matters: it proves that a high-tuition/high-aid policy is compatible with a substantial widening of access. And that’s good news for anyone who wants smart funding policies in higher education.


5 Responses
How do these numbers break down when you divide out colleges vs univiersities separately, though?
Is it an across-the-board increase, or are you seeing different impacts on different levels?
As the piece says, there’s no way to disaggregate this data. Previous work has shown that there is stratification in participation by type of institutions (ie ppl from wealthier families predominate at universities but not at colleges)
Absolutely true. The cost of tuition has nothing to do witha accesability. If such was the case Ontario, which has high and ever increasing fees, the Q1/Q5 ratio would go the other way (It would be interesting to plot average tuition fees versus gap, I don’t think there will be a significant correlation supporting views by some student leaders and ex-leaders), while in QC, where the fees were basically frozen for the duration of the study, the gap has not moved at all.
I read the original entry at Statscan, which is also publishing again the number and salaries of university profs, and hopefully more in these areas is displayed at their website
You can’t claim that you can use those numbers to measure the impact of something that was a constant the whole time (fees being lower in New-Foundland and higher in Ontario).
So if the cost of education isn’t the factor, what is? Access to debt? Or simply a desire to attend university? I would credit internet for making exchanges of ideas and information much easier; poorer people have an easier time seeing their options and seizing them, making higher education more likely to be a choice. Furthermore, the quality of primary and high school education may have improved.
A noteworthy gain in access would mean that the quintiles on graph 1 wouldn’t be that clearly separated; whatever gain is presented here is minuscule. Statistical significance does not mean that something is worthy of attention. Moreover, a true measure of access is not how many students access PSE, it’s how many people who wanted to access PSE and have the intellectual capacity to do so, do access it.
Note that what I really want is data about the well-being of graduates in regard to finding satisfying employment and dealing with their debt.
(By the way, CEGEPs are inexpensive but aren’t free.)
What is important, or SHOULD be important, is the quality of education accessed by students. Studying who goes (i.e., numbers) to university fails to touch on which universities, no. of students per class, access to professors, no. of part-time teachers as compared with full-time professors/researchers, length of courses, possibilities for students to conduct meaningful research, and so on. This collection of data merely indicates tuition costs are meaningless…. hardly the case, when important data are accessed.