

So, on Monday, I showed how Ontario universities are changing their enrolment patterns in response to changing demand and what we saw was that over the period 2009-2016, enrolments in Arts stayed flat while enrolments in STEM rose by nearly 40%.
But the question is: how have staff complements changed in order to deal with this? To answer this, I tried to look at changes in staff complements at the same nine universities. Unfortunately, Brock does not provide data on staff complements, while Ottawa does but for some reason has not updated its data since 2014, and Queen’s does but doesn’t break out Arts and Science (which are a single faculty there). So unfortunately, this little exercise is restricted to the 6 institutions in Ontario who can provide broken-out student and faculty data: Carleton, York, Ryerson, Waterloo, Western and McMaster (and many thanks to the Institutional Research people at each of these institutions who make this happen)
Anyway, enough methodology. Here’s what’s happened to student and faculty complements at these six universities combined:
Figure 1: Percentage Changes in Student and Faculty Numbers 2009-2016, Arts vs. STEM, 6 Ontario Universities
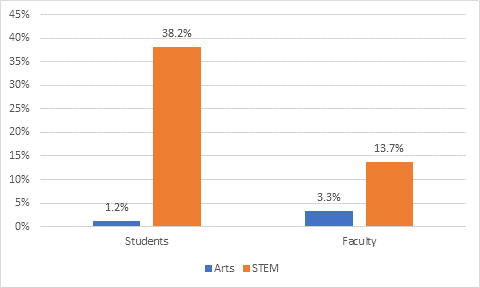
All those stories about Arts getting starved to feed STEM? That’s really hard to argue with these kinds of numbers. A story which is probably closer to the mark is that the lack of retirements in Arts faculties is preventing institutions from shifting resources over to where they are needed.
Or, that’s part of the story anyway. Something a little more complex emerges when you start looking at individual institutions.
Figure 2: Net Hires by Subject Area, 2009-2016, 6 Ontario Universities
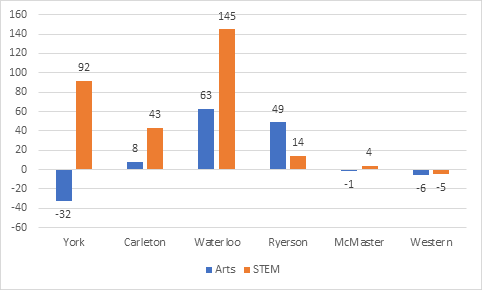
With respect to Arts, York, which of the six universities has seen the sharpest decline in enrolments, is the only one which is genuinely reducing its faculty complement in any way. Carleton, McMaster and Western are all more or less constant. Ryerson has seen a major increase in Arts enrolments, so it’s not unexpected to see an increase in numbers there. The real puzzle is Waterloo, where student numbers are up by 4% and Arts faculty is up by 25%.
But the real craziness is on the Science side, particularly at Ryerson, McMaster and Western. Ryerson added 2,996 students in Science and Engineering but only 14 professors, a ratio of one new prof per 214 students. McMaster added 2,595 students in STEM, but added only four profs, or one new prof per 649 students. And Western managed to add 1,909 students while reducing the STEM faculty complement by five professors.
What the heck is going on here? Well, we can sort of give a pass to McMaster. It had very slow revenue growth until 2015 when it suddenly had a huge and largely accidental spike in enrolment. So, it wasn’t exactly in a position to hire, and once it was, it was playing catch-up with an enrolment boom. If these numbers don’t change in the next couple of years, I’d be worried, but at least for now this one’s explainable and (sort of) justifiable.
But Western? Ryerson? Those are much harder cases to make. At both of those institutions revenues and expenses are up roughly 35% in real terms since 2009. Between them, they have $500 million in new annual revenues, 4900 new STEM students…and only 9 new STEM faculty. I don’t think there’s any two ways about this: both of these institutions are using new STEM enrolments as cash cows and not putting anything back. STEM students at these two universities are getting screwed. They – and their parents – have a right to be very angry about this.
So to sum up: student preferences are changing, with STEM coming to be preferred over Arts. Accounting for a bit of a lag, university admissions are changing, with STEM now larger than Arts. But when it comes to faculty numbers and hiring, STEM is not getting the attention it deserves. The result is greatly inflated student-teacher ratios in STEM. Partly that’s about lack of money and the problems of managing an inflexible, tenured workforce. But there are also some very weird hiring decisions being made at an institutional level, which really need to change.
 Tweet this post

Do the staff data include contingent faculty? Universities may be deferring establishing tenured posts until enrolment changes are sustained over a longer time.
Might some universities have had some under used capacity in the sciences which recent enrolment increases have absorbed?
1. No, this is FT only. Almost certainly what unis are doing is meeting marginal demand with contingent faculty. But after 7 years of continuous increases you’d think unis are able to determine the direction of the trend.
2. Conceivably you could make that case at Western, where FT student-faculty ratios were about 15-1 at start of period (now 23-1). At Ryerson, it’s gone from 20-1 to 30-1 and at McMaster it’s gone from 25-1 to 31-1.
To be fair, distinguishing between FT and PT obscures the fact that not all FT faculty are tenure-stream. In nearly any humanities department nowadays you’ll find faculty whose job titles are Adjunct Assistant Professor or Assistant Professor (Limited Term) or Lecturer; these people are usually full-time members of their departments on long-term contracts, but certainly aren’t comparable to tenured or tenure-track professors. With that in mind, I’d question whether your numbers accurately capture what’s happening on the ground.
The notion that enrolment growth leads to faculty complement growth is nice, but also demonstrably false. At my institution, current enrolments are 10% higher than six years ago, a good 30% higher than 12 years ago, and 50% higher than 18 years ago; faculty complement has stayed pretty much the same. Key class sizes went from 100 to 200 to 400 to 600 to compensate, and nonetheless with more sections at the largest size.
The analysis seems to ignore that some non-STEM departments do significant service teaching to STEM majors; for example, Waterloo has added communications course requirements for their STEM co-op students, running them with rather small class sizes (~20 to ~30), perhaps explaining the Arts hiring there?
Combining these two points, the increased service load with no (or limited) new hires in those departments means that major programs in those areas struggle to cover curriculum, offerings shrinks, programs decline in richness, and students who graduate from these programs (and their parents) may not be the best ambassadors for these struggling programs. On the other hand, growth in Engineering, for example, requires new labs, which typically means whole new buildings, and students who pass through shiny new facilities (and their parents) become great ambassadors for that program. And, in fact, when the investment is primarily in Engineering, the departments that can have their programs negatively affected by the increased service load include the math and science departments.
Putting it together, I will suggest the decisions made by a university to invest particularly in Engineering without increasing resourcing to the service teaching units may well affect applications and admissions to those other programs. The idea that faculty complement should follow enrolment growth seems damaging to me.