


Every once in awhile you have to just sit and marvel at what the Chinese government has managed to pull off in higher education. Since the turn of the millennium, enrolments have increased five-fold. That’s staggering enough, but check out figure 1 below.
Figure 1: Change in Enrolment and Size of 18-21 Cohort, 2000-2017 (2000 = 100)
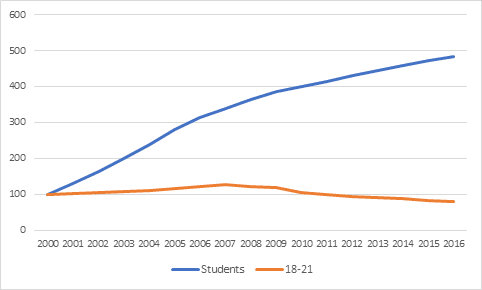
That five-fold jump in enrolment? It occurred at the same time as a 21% drop in the size of the 18-21 cohort (in fact, if we look only at the period from 2007 onwards, the drop is close to 40%). That is, frankly, phenomenal.
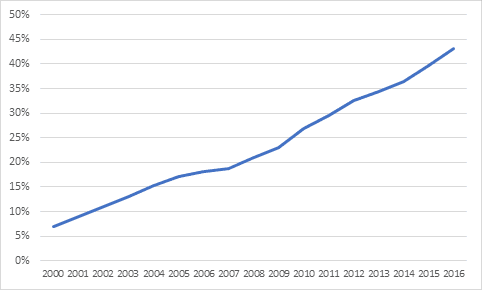
We can portray this data another way, by showing net enrolment rates over time. Gross enrolment rates is simply the total number of students divided by the size of the university-age population (ie. 18-21). This is shown below in figure 2. When you take into account not just the increasing number of students but the declining base population, the increase is closer to seven-fold in just sixteen years.
Figure 2: Gross Enrolment Rate, People’s Republic of China, 2000-2017
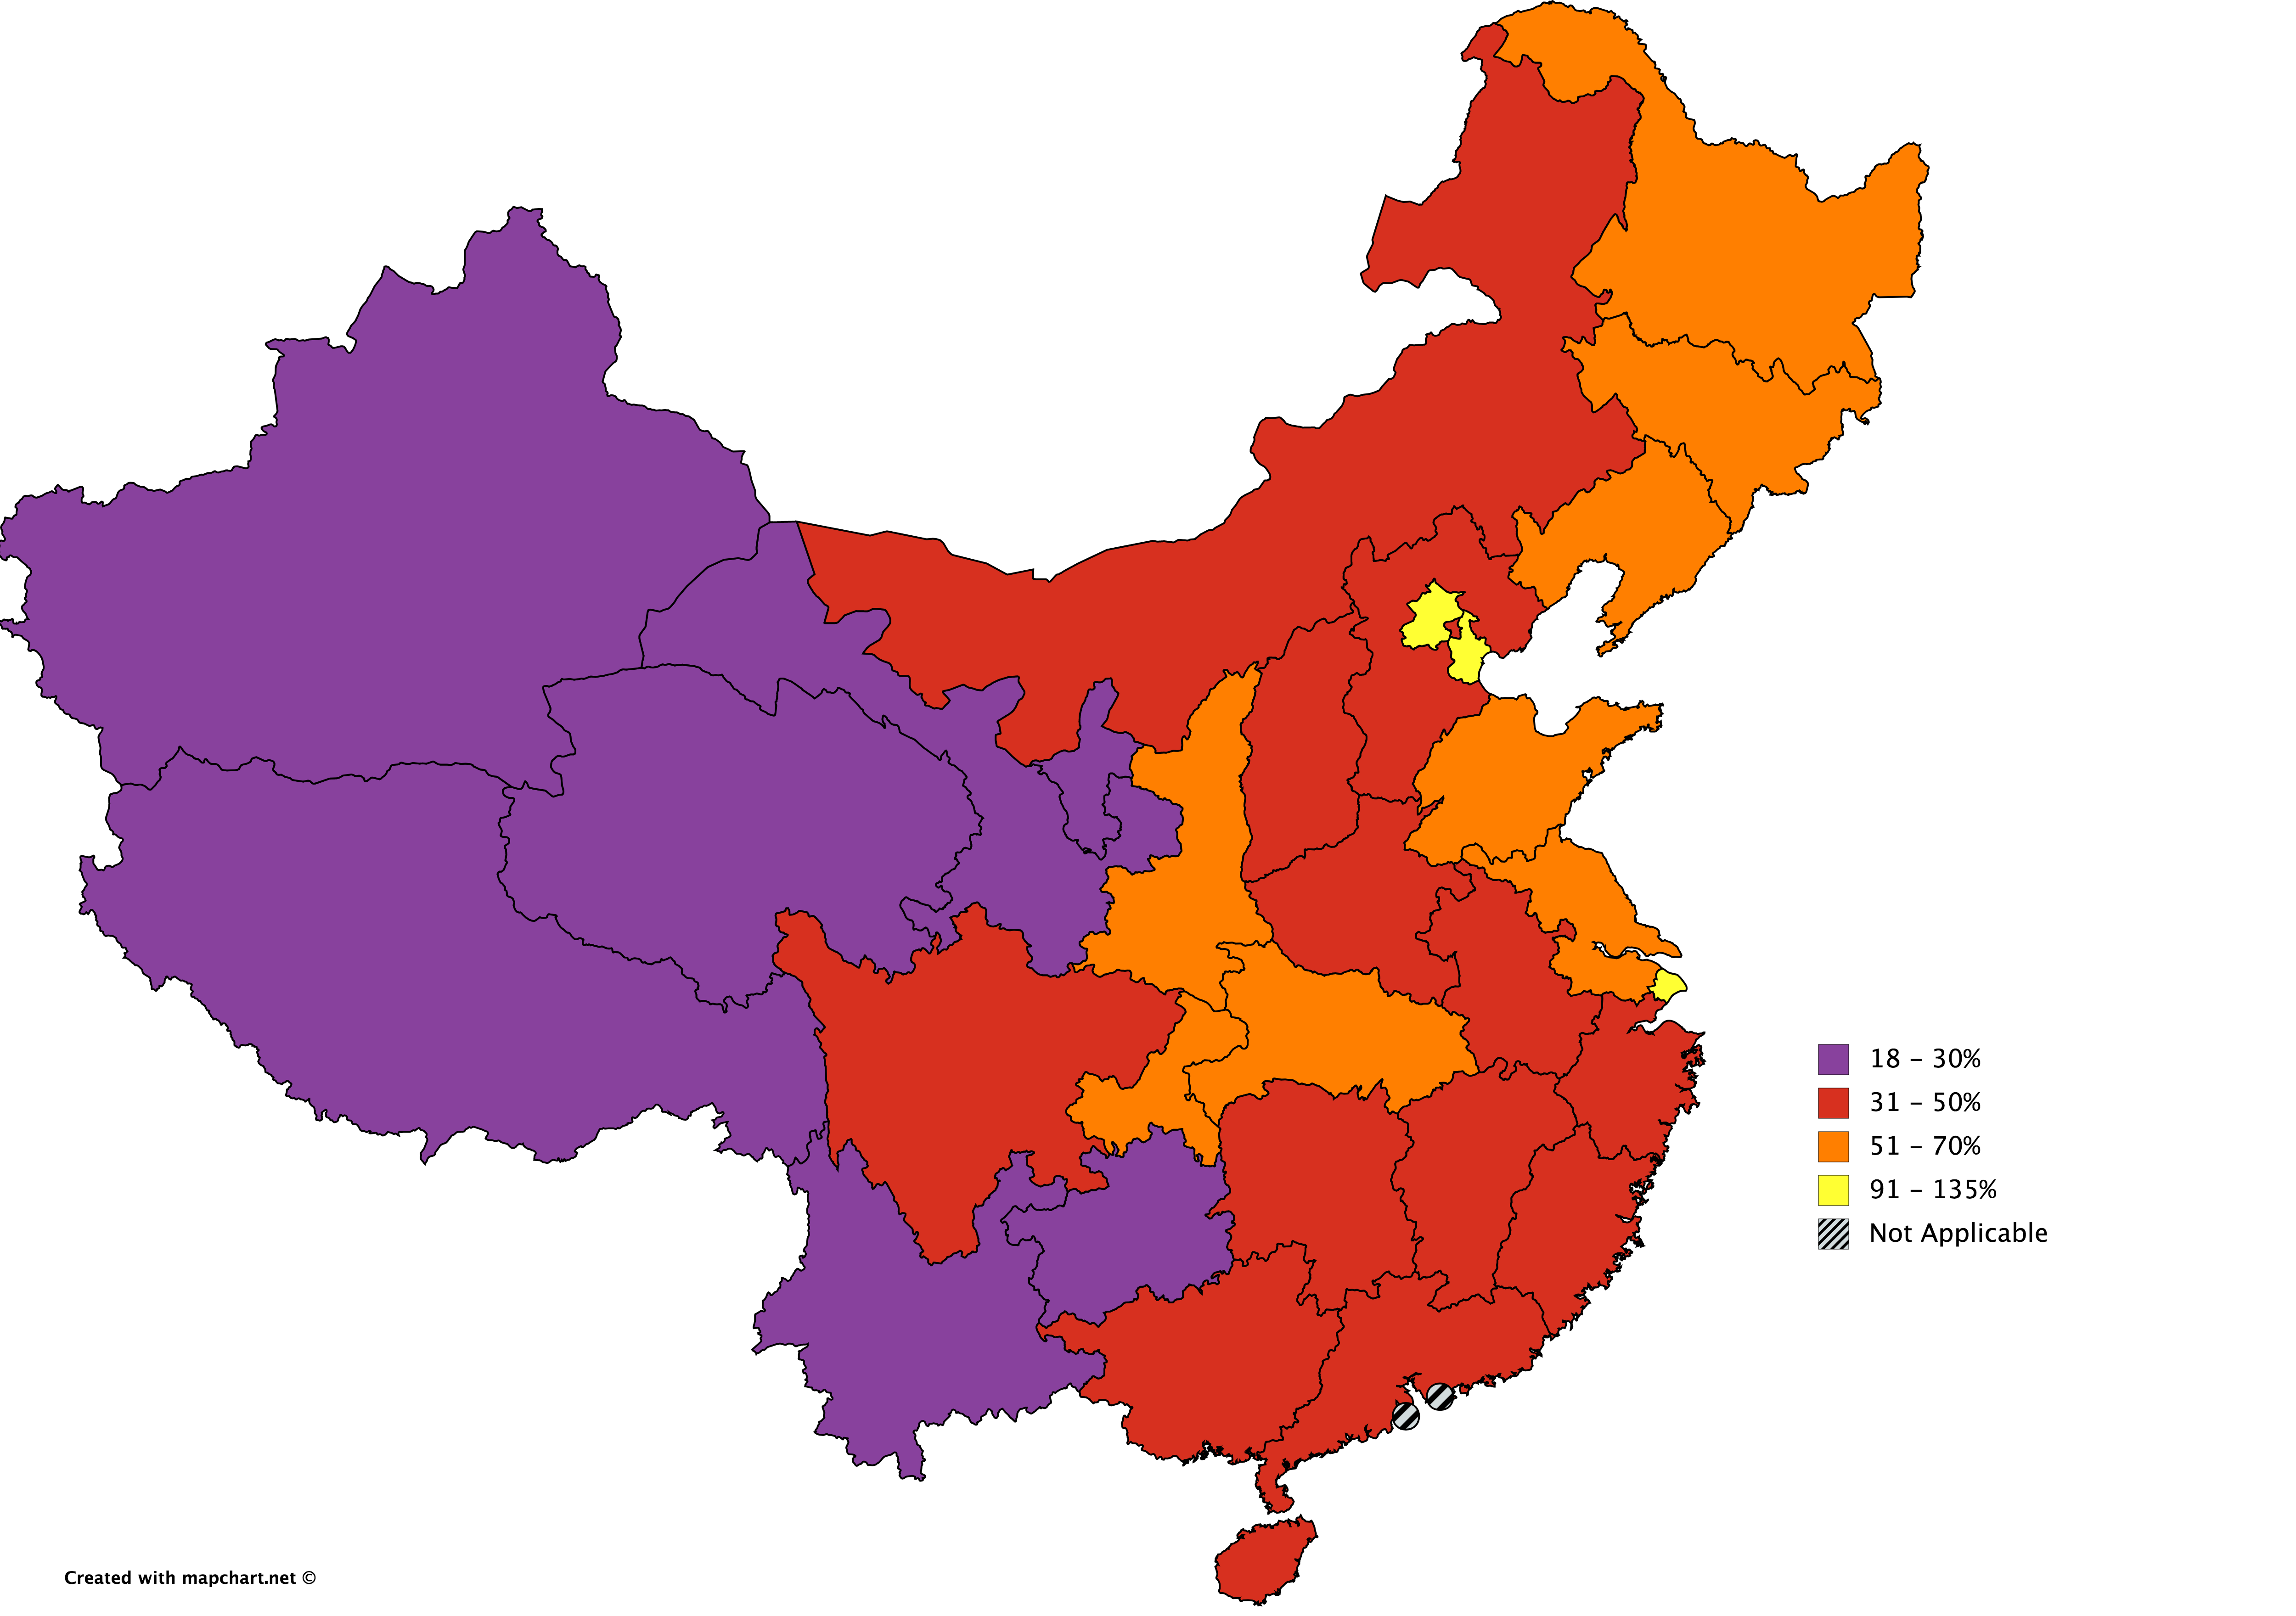
Of course, not all regions of China are created equal. In the rich coastal areas, participation rates are sky-high; even higher than in most developed countries. In Tianjin and Beijing, Gross Enrolment rates exceed 100% (this is possible either because a significant number of students are outside the 18-21 age range, or are immigrating from outside the jurisdiction to attend school there, or both), and Shanghai’s rate is over 90%, all of which are equal to or higher than that in Canada (if memory serves, our Gross Enrolment Rate is about 90% if you include both college and universities, or about 60% if you only count universities). However, as one heads inland the numbers fall significantly: in sparsely populated and thinly industrialised Tibet and Qinghai, the Gross Enrolment Rate is under 20%.
Figure 3: Gross Enrolment Rate by Province, People’s Republic of China, 2016
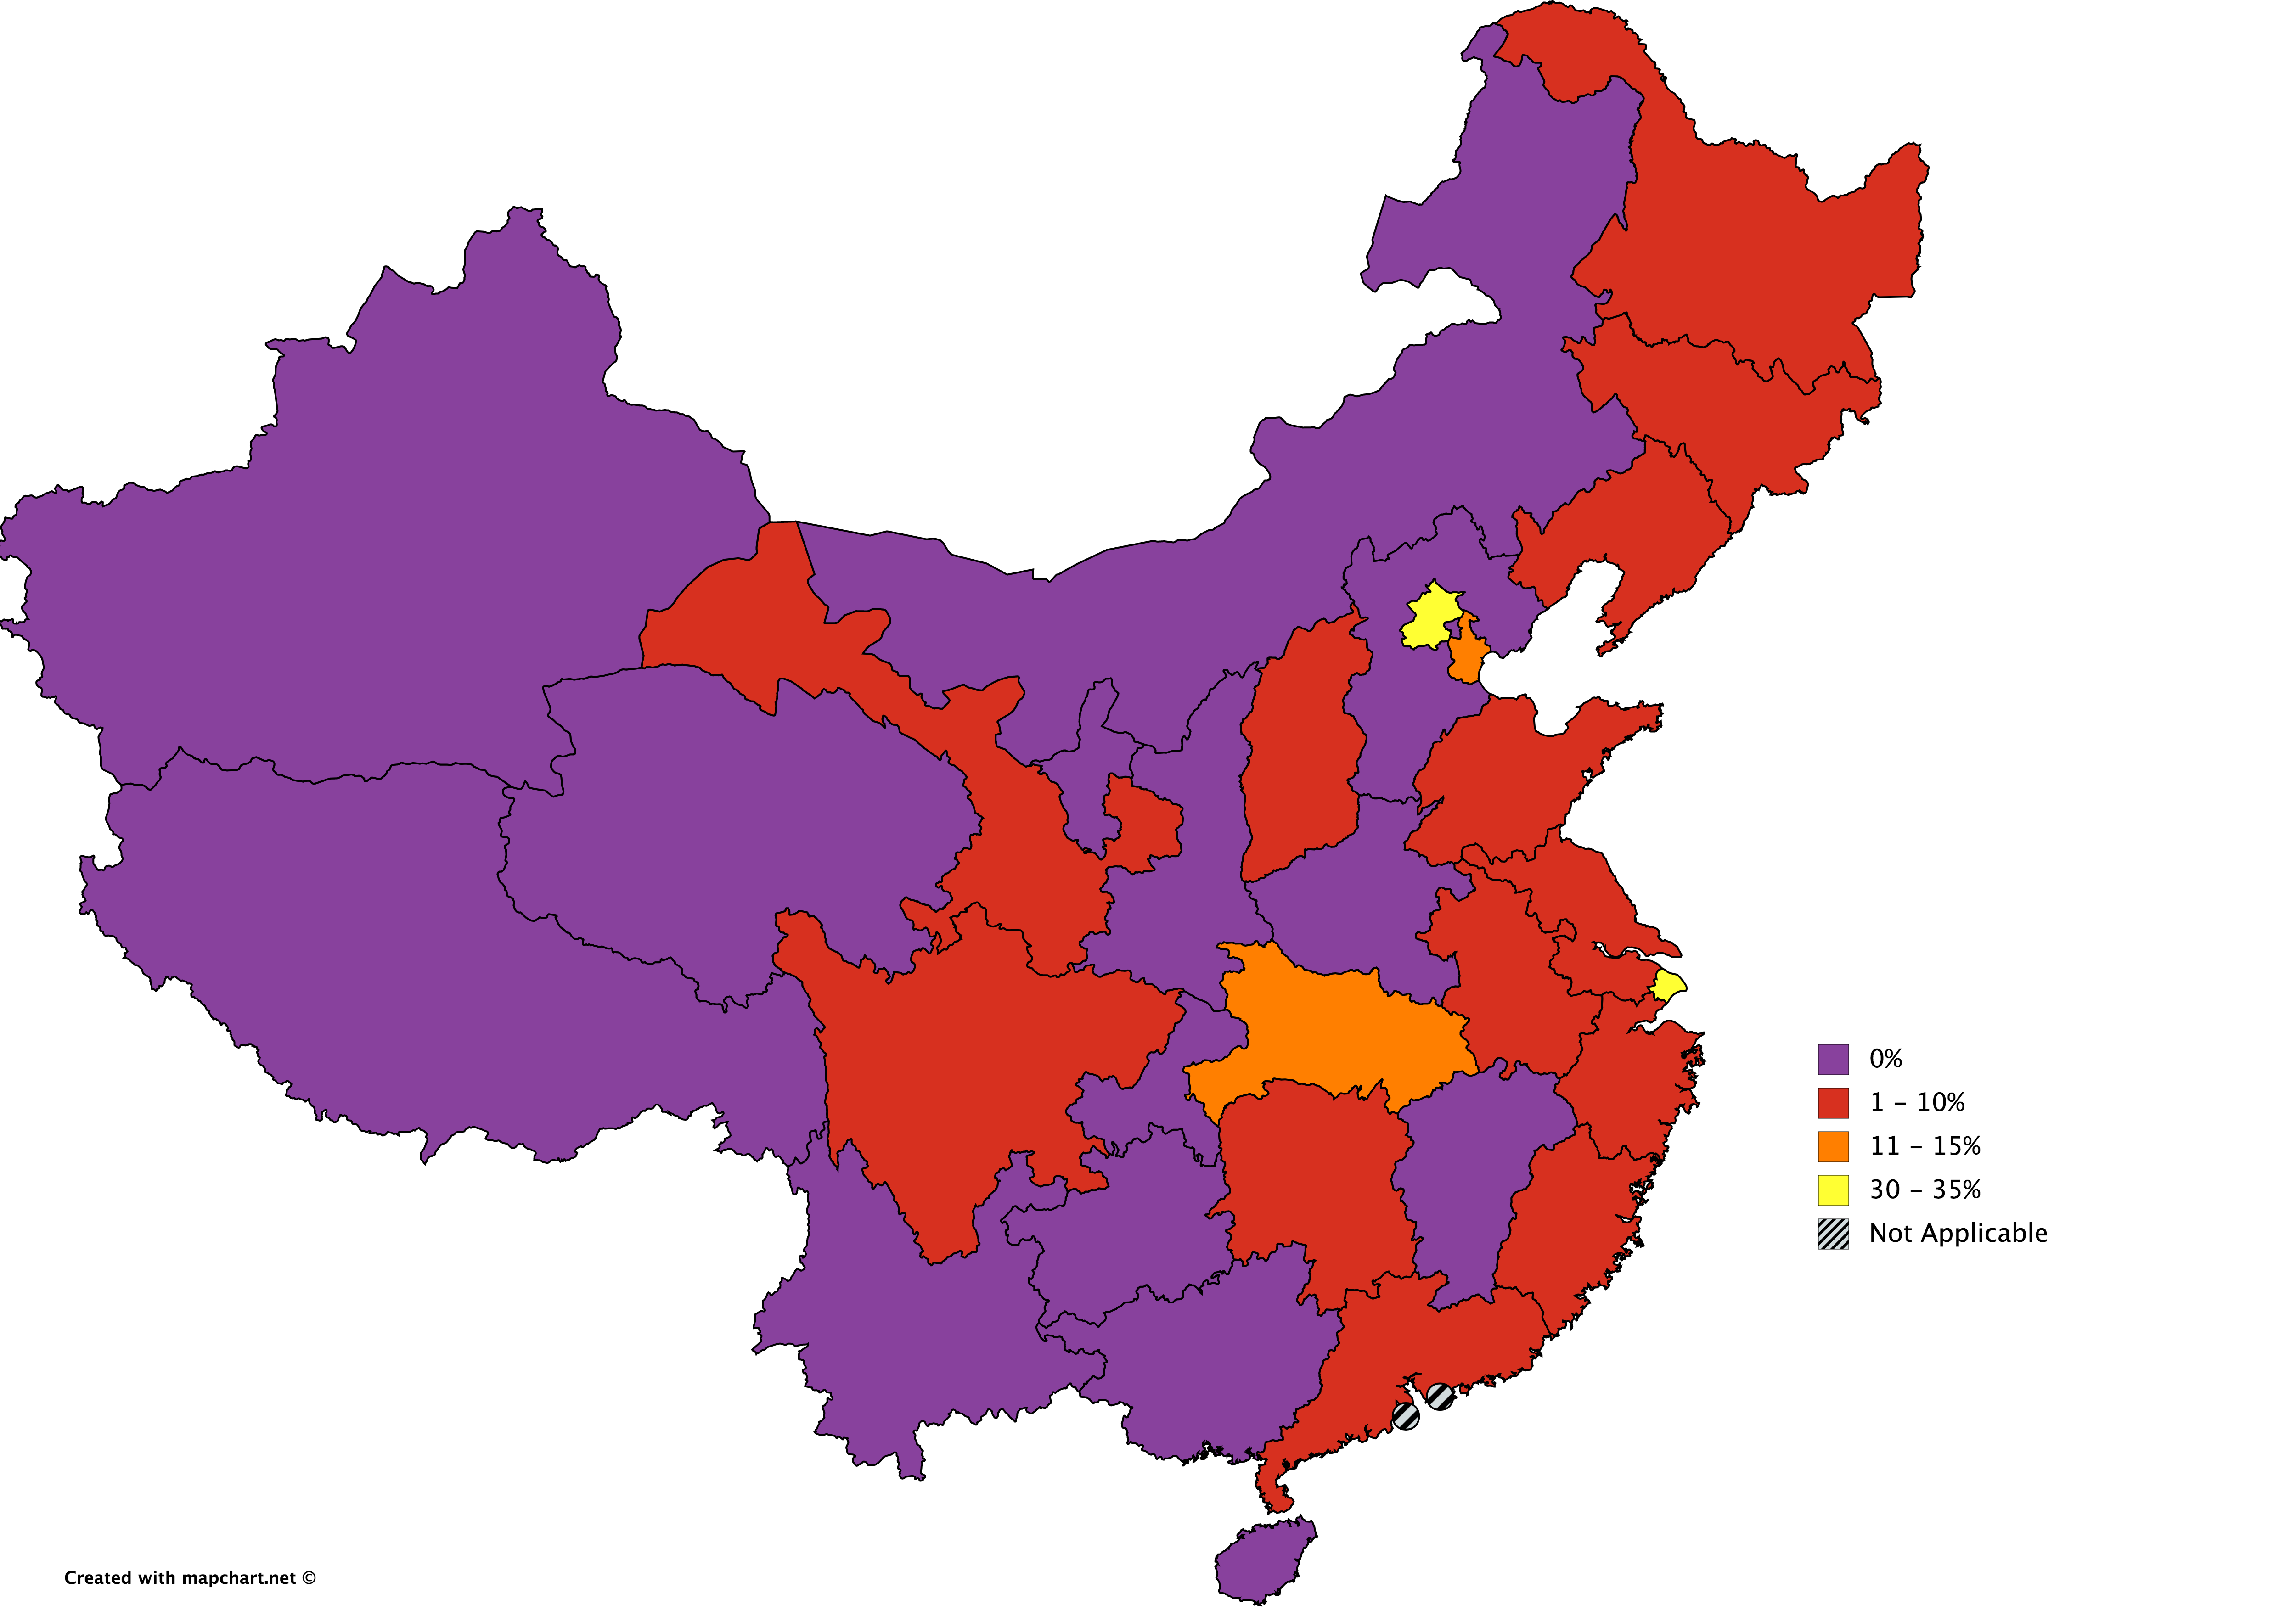
But of course, it’s not just gross enrolment that matters. In China, perhaps more so than elsewhere, where one goes to school is a matter of great import: the prestige of the institution attended makes an enormous amount of difference, which is why secondary students spend such ridiculous amounts of time swotting for their gaokao (university entrance) examinations. But quality institutions are fairly concentrated. In Beijing and Shanghai, roughly one-third of students attend institutions which are ranked in the top 500 globally, as measured by the Shanghai rankings. Hubei, Tianjin and Jilin also have 10% or more of their students in such institutions, but after that it falls off pretty quickly. In the country as a whole, it is just 5% (the corresponding figure in Canada is about 70% if you look just at university students, and 50% if you include both college and university), and in 14 of the country’s 31 provinces, major municipalities and autonomous regions (I’m excluding the two Special Administrative Regions of Macao and Hong Kong here because their data is not typically included in PRC datasets), there are no students enrolled in top institutions.
[the_ad id=”12691″]
Figure 4: Percentage of Enrolments in Global Top-500 Institutions, by Province, China 2016
And so that’s China in a nutshell: rapid increases in enrolment in mostly not-world-class institutions, and huge geographic divides between rich coastal areas and the interior provinces both in terms of the quantity and quality of higher education on offer.

