


I’ve been playing around with funding data and discovered something a bit mind-altering. It has to do with Ontario and how different it is from the rest of the country when it comes to post-secondary funding.
(All of the following graphs show income of PSE institutions – that’s colleges and universities together – from public and private sources expressed as a percentage of GDP. Data for other countries come from OECD Education at a Glance 2018; data for Canadian provinces takes data from the FIUC and FINCOL surveys of university and college revenues, respectively, and divides totals by provincial GDP at 2017 market prices as shown by Statscan on datatable 36-10-0222-01)
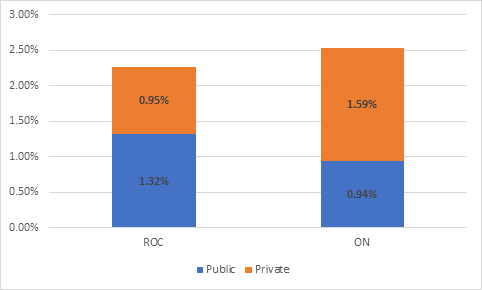
Here’s Ontario versus the rest of Canada. Public funding in Ontario is much weaker than elsewhere: 0.92% of Ontario’s GDP vs. 1.32% in the Rest of Canada (ROC). But private funding – that is from fees and other sources – more than makes up for it, such that institutional income in Ontario totals about 2.5% of GDP, as opposed to 2.37% in the ROC.
Figure 1: PSE Funding as a % of GDP, Ontario vs. Rest of Canada, 2016-17
(For all you super-finance-nerds out there: yes, 2016-17 is a bit of an outlier year because of the killer returns on endowment income which inflates the private numbers a bit. But the story wouldn’t change substantially if I used another year).
Now, if we look at Ontario and ROC in international context, as we do in Figure 2, we realize that Ontario is in a group together with the US and Chile in terms of having the highest overall levels of funding in terms of percentage of GDP, and in a group with those two plus Korea, Japan and the UK in having the highest levels of private funding (roughly 2/3 private, 1/3 public). When Canadians want to scare the children about pretty much anything, they often say “oh noes, soon we’ll have an Americanized system!” Well, as it turns out, as far as funding of the PSE system goes, for all intents and purposes we’re already there (and be honest – it’s not that bad, is it?).
Figure 2: PSE Funding as a % of GDP, Selected Jurisdictions, 2016
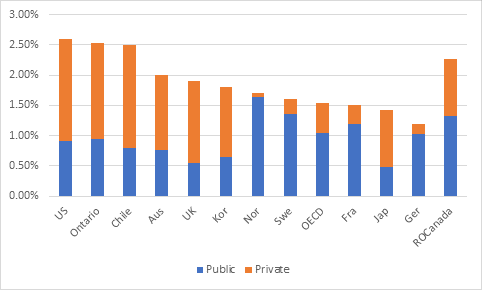
Meanwhile the rest of Canada looks like…well, like no other country at all, really. It has European levels of public funding (higher than Germany, very close to Sweden), but combines it with Japanese levels of private financing, too. If really is kind of sui generis.
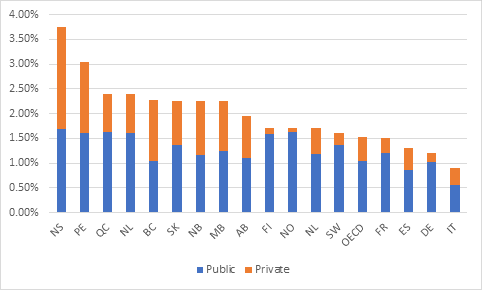
We can see this even more clearly if we pull apart the “Rest of Canada” figure into individual provinces and compare them to a selection of European countries – you know, the ones that are so progressive, etc – as I do below in figure 3. It turns out that every single Canadian province has public spending on post-secondary which is higher than the OECD average, and they combine that with substantial private funding. The result is that there is no EU country where total funding to post-secondary institutions is as high as the poorest Canadian province.
Figure 3: PSE Funding as a % of GDP, A Bunch of Other Selected Jurisdictions, 2016
Two take-aways here: first, from a funding perspective, Canada is very much a place of two solitudes. One is Ontario, which has a funding system almost identical to the United States, and the other is the rest of the country, which combines European levels of public funding with Asian levels of public funding.
And second: if Canadian post-secondary institutions can’t make ends meet on what is quite clearly among the most generous funding regimes in the world, we probably need to ask some serious questions about why the system is as expensive as it is.


4 Responses
If you’ll forgive me, permit this lurker to respond to your last question with some follow-up questions:
1) How would any of this look if you restricted to universities? After all, a lot of the training offered by Canadian public colleges is traditionally offered at the high school level in Europe and Asia, and vocational training can be pricy on a per-student basis.
2) Restricting to the university sector, universities in Canada and the US tend to offer a fair amount of non-degree extension/adult education—does this figure at all in Europe and Asia?
3) To what extent is Canadian and US PSE slammed, in comparison, by economy of scale issues? After all, European and Asian public institutions tend to be larger institutions serving far more concentrated populations.
The first two issues could well be negligible, but if they’re significant, then these comparisons aren’t quite apples-to-apples—restricting to universities and then to colleges/public post-secondary vocational training might already be instructive in this regard. As for the third issue, would parallel comparisons of funding levels for other public services, e.g., health care, make for a helpful control?
Is it more or less mind altering when the number of students in each jurisdiction is factored in? Public/private funding aside, is ON (and ROC) serving proportionately (relative to the population) more students?
One obvious answer to your second question might be that we put larger numbers through our systems
I wonder if measuring funding against GDP really indicates which are “clearly among the most generous funding regimes in the world.” Shouldn’t it be measured against numbers of students?
Or to put it another way, one of the reasons “why the system is as expensive as it is,” must be that it educates more students than other systems. This needn’t mean that it’s inefficient.