


On Thursday, the Office of Parliamentary Budget Officer (PBO) released a report on the state of the Canadian labour market. It’s one of those things the PBO does because the state of the labour market drives the federal budget, to some extent. But in this report, the PBO decided to do something different: it decided to look at the state of the labour market from the point of view of recent graduates, and specifically whether graduates are “overqualified” for their jobs.
The methodology was relatively simple: using the Labour Force Survey, determine the National Occupation Code (NOC) for every employed person between the ages of 25 and 34. Since NOCs are classified according to the level of education they are deemed to require, it’s simple to compare each person’s level of education to the NOC of the job they are in, and on that basis decide whether someone is “overqualified”, “underqualified” or “rightly qualified”.
So here’s what the PBO found: over the past decade or so, among university graduates, the rate of overqualification is rising, and the rate of “rightly qualified” graduates is falling. Among college graduates, the reverse is true. Interesting, but as it turns out not quite the whole story.
Now, before I get into a read of the data, a small aside: take a look at the way the PBO chose to portray the data on university graduates.
Figure 1: Weaselly PBO Way of Presenting Data on Overqualification Among 25-34 Year Old University Graduates
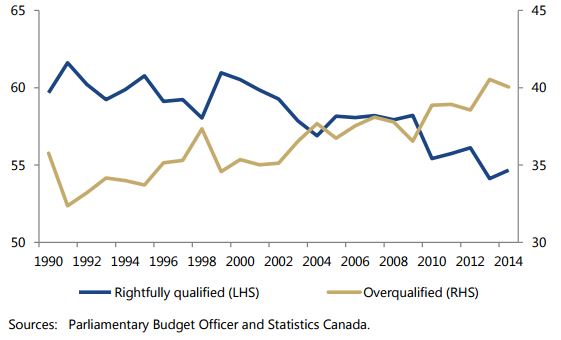
Wow! Startling reversal, right? Wrong. Take a look at the weaselly double Y-axis. Here’s what the same data looks like if you plot it on a single axis:
Figure 2: Same Data on University Graduate Overqualification, Presented in Non-Weaselly Fashion
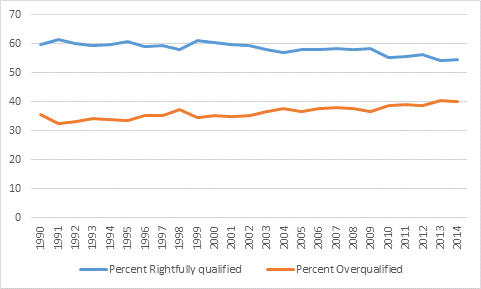
See? A slightly less sensational story. Clearly, someone in PBO wanted to spice up the narrative a bit, and did so by making a pretty unforgivable graph, one that was clearly meant to overstate the fundamental situation. Very poor form from the PBO.
Anyways, what should we make of this change in university graduates’ fortunes? Well, remember that there was a massive upswing in university access starting at the tail end of the 1990s. This meant a huge change in attainment rates over the decade.
Figure 3: Attainment Rates Among 25-34 Year-Olds, Canada
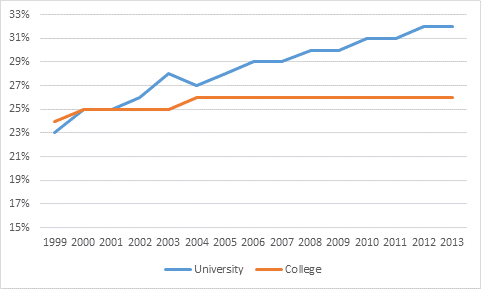
What this upswing in the university attainment rate meant was that there were a heck of a lot more university graduates in the market in 2013 than there was, say, a decade earlier. In fact, 540,000 more, on a base of just over a million – a 53% increase between 1999 and 2013. Though the PBO doesn’t mention it in the report, it’s nevertheless an important background fact. Indeed, it likely explains a lot of the pattern change we are seeing.
To see how important that is, let’s look at this in terms of numbers rather than percentages.
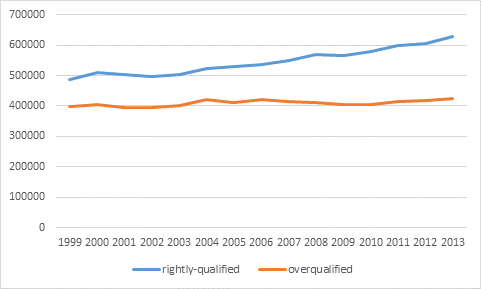
Figure 4: Numbers of Rightly-Qualified and Overqualified 25-34 Year Old University Graduates, 1999-2013
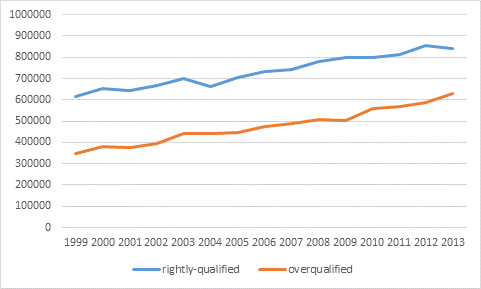
In fact, the number of rightly-qualified graduates is up substantially over the last decade, and they’ve been increasing at almost (though not quite) as fast a rate as the number of “overqualified” graduates. For comparison, here’s the situation in colleges:
Figure 5: Numbers of Rightly-Qualified and Overqualified 25-34 Year Old College Graduates, 1999-2013
As advertised, there’s no question that the trend in college outcomes looks better than the one for universities. Partly that’s because of improvements in colleges’ offerings, and partly it has to do with the run-up in commodity prices, which made college credentials more valuable (remember the Green-Foley papers? Good times).
What should you take from all of this? If nothing else, don’t forget that comparing university outcomes over time is hard because of the changing size and composition of the student body. Remember: the median student today wouldn’t have made it into university 25 years ago. Average outcomes were always likely to fall somewhat, both because more graduates means more competition for the same jobs, and also because the average academic ability of new entrants is somewhat lower.
It would be interesting, for instance, to see these PBO results while holding high school grades constant – then you’d be able to tell whether falling rates of “rightly-qualified” graduates were due to changing economy/less relevant education, or a changing student body. But since we can’t, all one can really say about the PBO report is: don’t jump to conclusions.
Especially on the basis of those godawful graphs.


2 Responses
I didn’t begin to work in student services until 2002 but, at the time, it seemed as though many students were just beginning to realize the benefits of transfer articulation agreements between colleges and universities. Could some of the increase in attainment rates in Figure 3 be attributed to students beginning to go back for a degree after completing a diploma?
Good question. Don’t know. Not sure how one could answer that.