


The 2015-16 version of Financial Information of Universities and Colleges Survey (which, confusingly, doesn’t include community colleges) was released over the summer. As in previous years I’m going to do a little summary of what it tells us about how income and expenditure has change over one year and five years. Just so we’re all clear, all figures here are in real (i.e. inflation-adjusted) dollars. And – caveat – comparisons with 2010-11 are a little weird because Quebec universities changed their fiscal year-end that year and only reported 11 months of data, meaning that nationally, reported expenditures for that year are probably about 1.5% lower than they normally would be. This means that 5-year averages are probably inflated slightly compared to reality.
For starters, let’s look at total income by source, which was $34,385 million. That’s down nearly 5% from the previous year, though the a little over 75% of the drop is due to a fall in endowment income (apparently everyone got hammered in 2015). Income from governments fell by a little under 2%, nearly all due to reductions at the provincial level. Over the past five years, revenue from government is down by a stonking 12.6%. However, rising fee income mostly compensates for this: it rose by nearly 5% over 2014-15 and 27% over 2010-11. For the most part, these increases are not coming from domestic student fees, they are coming from increases in international student enrolment.
Figure 1: Change in Total Income by Source, Canadian Universities, 2015-16

What’s really interesting about the total income numbers is how small the government numbers are becoming. Already as of 2014, the university sector as a whole took in more money from non-governmental sources (fees, donations, sale of goods and services, etc) than it did combined from the federal and provincial governments. On current trends, income from student fees will surpass provincial government grants to universities in 2020-21, and will pass combined federal and provincial contributions in 2024-2025. At which point it would be fair to say we will have moved from a public university system to a publicly-assisted university system.
Now, on to the changes in income by Fund, which I show below in Figure 2. This tells a slightly different story. Operating income actually kept pace with inflation in 2015-16 and over a five year period actually increased by 8.8%. Endowment income fell from about $1.5 billion to about 27 million, or a fall of roughly 98%, but this is an erratic income source and like I said last year was a bad year. Capital expenditures are down substantially, but recall that in the base year of 2010-11 the feds were sacrificing billions to the Construction Industry Gods to keep the recession at bay; in fact, current capital expenditure is close to the 30-year norm. The interesting piece is that sponsored research income is down 6% over the past five years.
Figure 2: Change in Income by Fund, Canadian Universities, 2015-16

On to expenditures by type. Total expenditures are roughly unchanged either over one year or five years. If you’re wondering how this is possible when income is down, recall that most of the income drop is in endowment, which has very little impact on year-to-year spending since it’s supposed to all be salted away anyway. But while total expenditures are unchanged, some fairly big line items continue to rise, over the medium if not the short term. Academic salaries by 7.5%, salaries to non-academic staff 8.3%, total compensation (including benefits) 8.3% and scholarships – three-quarters of which go to grad students – up by a whopping 16.4% since 2010-11. Total scholarship expenditures are now just shy of $2 billion, which means institutions are giving back to students over 20 cents of every dollar they collect from students; from domestic students the figure is closer to 30 cents.
Figure 3: Change in Selected Types of Expenditure, Canadian Universities 2015-16
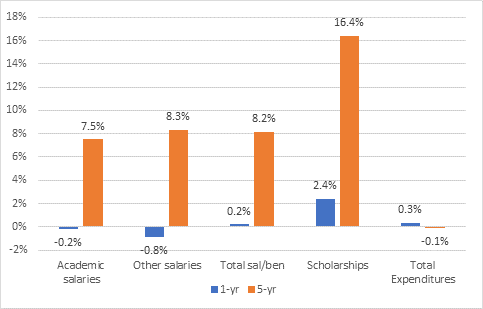
Now you may well ask yourself: wait a minute. Total expenditures are flat, but salaries and scholarships are rising. So how does this balance? Well, simple enough: non-salary, non-scholarship expenditures have fallen by 14% in the last five years in constant dollars. Some of that is just buildings not getting built (no loss, in the eyes of some), but other things are getting squeezed, too; notably, renovations, travel and printing.
Finally, let’s look specifically at what’s going on inside the operating budget (that is, excluding ancillary, capital, research and the like) which accounts for about 60% of the total. Figure 4 shows that overall, operating expenditures rose by 14.3% over five years. How is this possible when operating income only rose 8.8% you ask? Mainly, because universities have been trimming margins: universities were running surpluses five years ago and mostly aren’t any more.
Figure 4: Changes in Operating Budget Expenditures, Canadian Universities, 2015-16
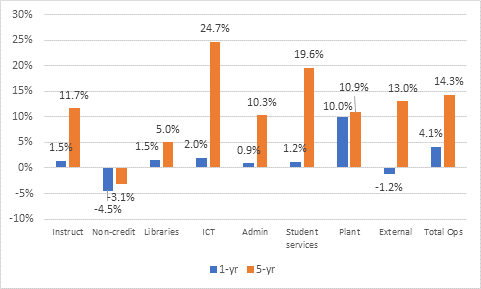
The big expenditure increases are in ICT and student services. In the case of student services, an awful lot of that increase is scholarships. In ICT, interestingly, the cost of equipment purchased has actually gone down: the increases are in staff costs, consulting contracts, professional fees and equipment rentals. Make of that what you will. The biggest piece of the pie – Instruction and non-sponsored research (meaning basically what it costs to run core academic functions), which takes up about half the operating budget – is up 11.7 % over five years.
So there you go. Don’t say financial reports aren’t fun.

