





I haven’t looked at the state of interprovincial student mobility in Canada in awhile (last time was back here in 2021) and today seems like as good a time as any to catch up on the latest data. Ready? Let’s go!
First, a quick methodological note here: this data does not include colleges (very, very few college students choose to study out-of-province, on the order of about 2%) and at the university level includes students at all degree levels but does not differentiate between them. Figure 1 shows the percentage of Canadian university students studying in a province other than their province of origin. For about twenty-five years, the percentage of such students rose very slowly, from about 6.3% in 1992/93 to 8.4% just before COVID (you can ignore that dip in the late 90s; Quebec didn’t bother reporting out-of-province numbers the year it began charging differential fees to out-of-province students). Then COVID hit and the numbers dropped by a percentage point or so before recovering somewhat to about 8%.
Figure 1: Percentage of Domestic Students Studying Outside Their Home Province, Canada, 1992-93 to 2023-24
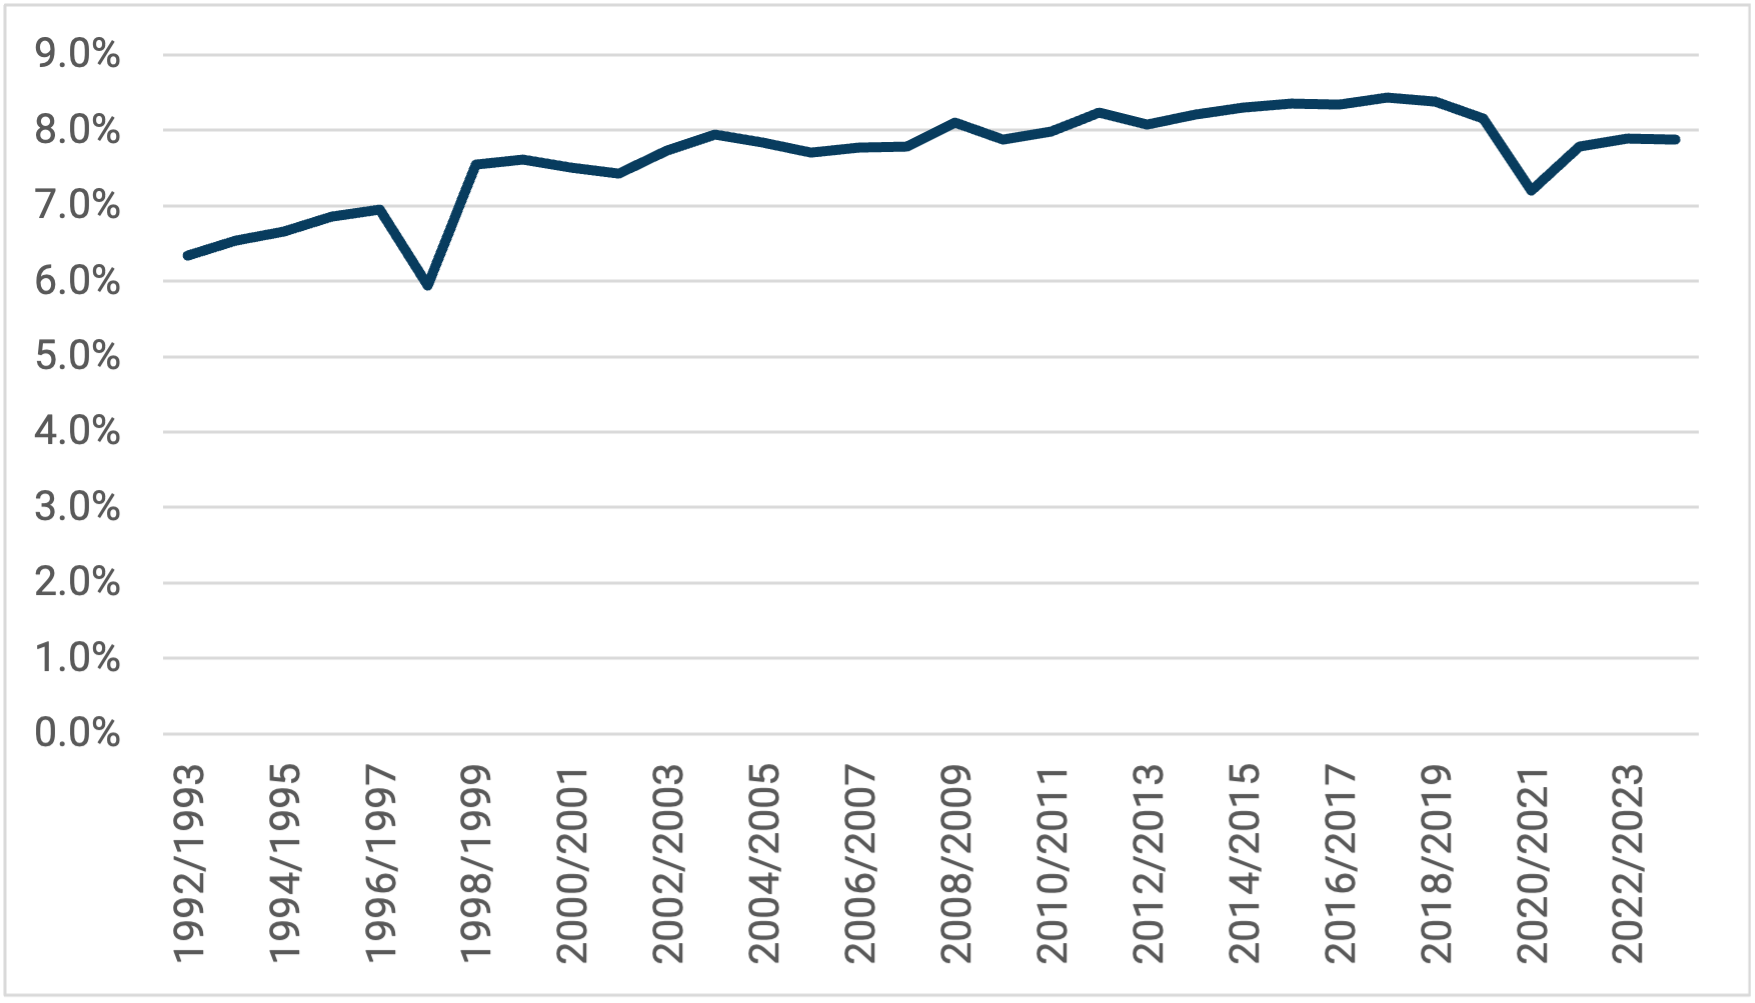
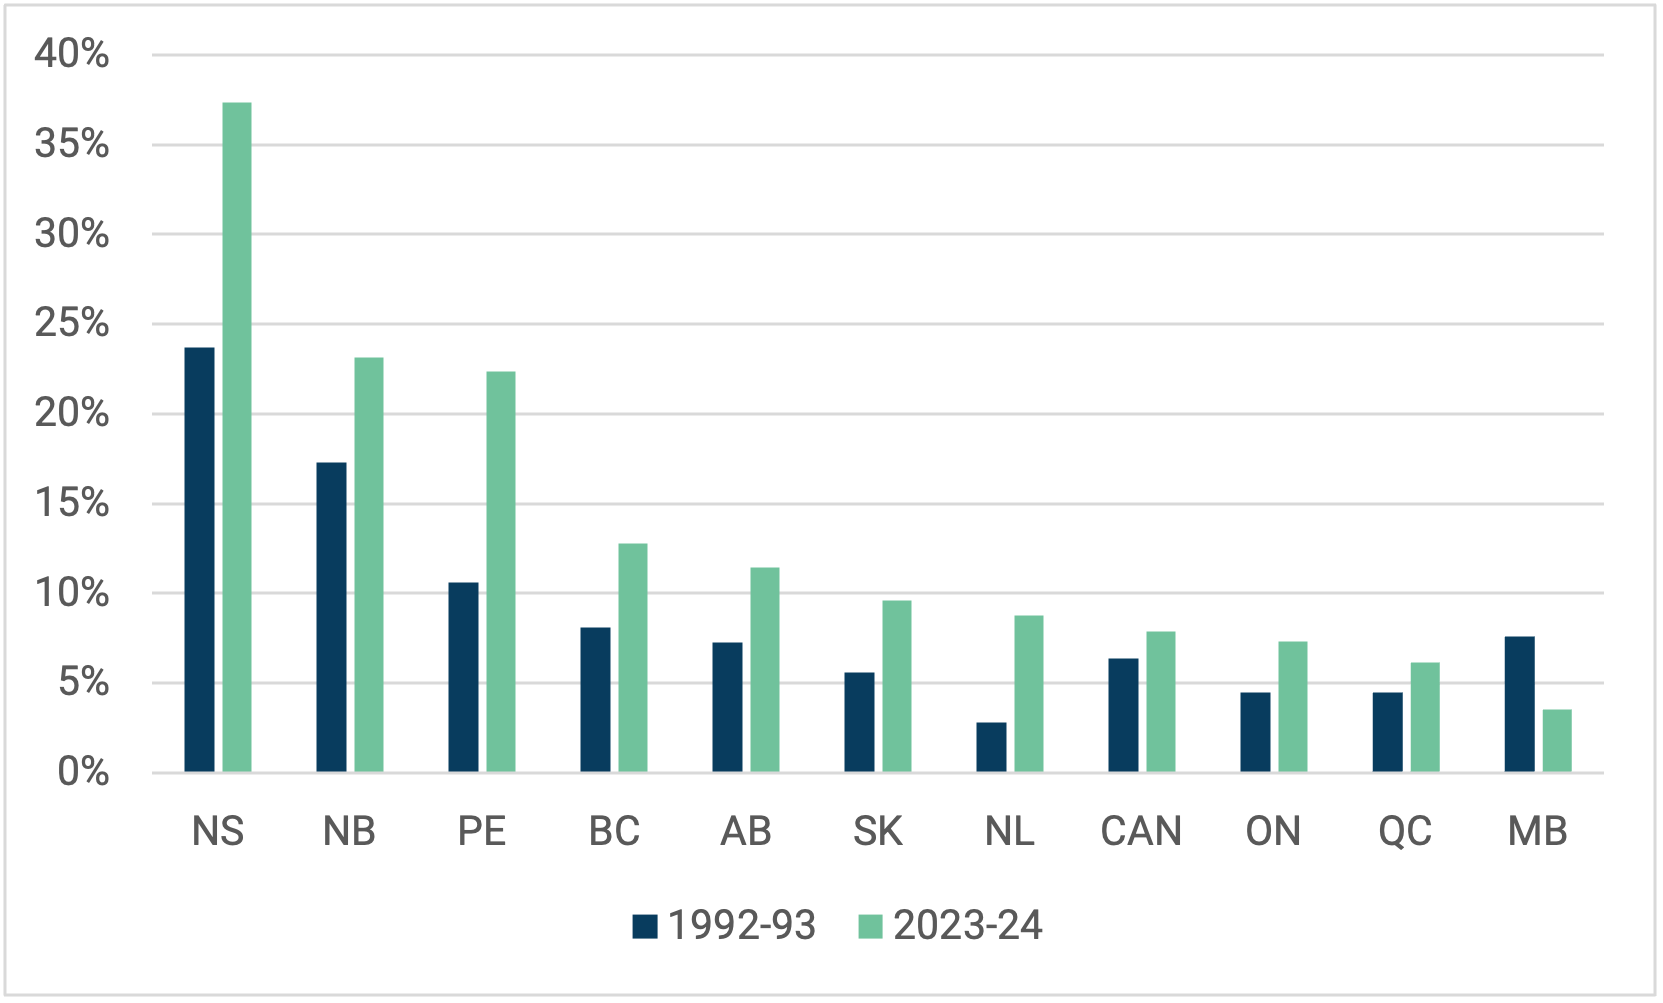
Figure 2 shows the percentage of each province’s domestic students who are from other provinces (international students excluded, meaning these are percentages of domestic students rather than percentages of all students), both in 1992-93 and in 2023-24. As can be seen, apart from Manitoba, every province has seen an uptick in the percentage of students studying from other province. This is perhaps most surprising in Quebec, where of course out-of-province students saw their tuition rates triple in this period. The other clear implication from figure 2 is that the maritime provinces exist in a completely different world that the rest of Canada with respect to student mobility. In those three provinces, roughly three in ten Canadian students are from another province, compared to less than seven percent in the rest of the country.
Figure 2: Domestic Students From Other Provinces as a Percentage of All Domestic Students, by Province, 1992-93 vs. 2023-24
Generally speaking, provinces that import students don’t import the from all that far away. Figure 3 shows the percentage of out-of-province, by province, who come from a neighbouring province (for clarity, I treat Newfoundland as only having one neighbour (Nova Scotia) and New Brunswick and Nova Scotia as having three each (QC/NS/PE in the former case, and NB/PE/NL in the latter). In six out of ten provinces, fifty percent or more of students come from a neighbouring province.
Figure 3: Domestic Students from Neighbouring Provinces as a Percentage of all Out-of-Province Students, by Province. 2023-24
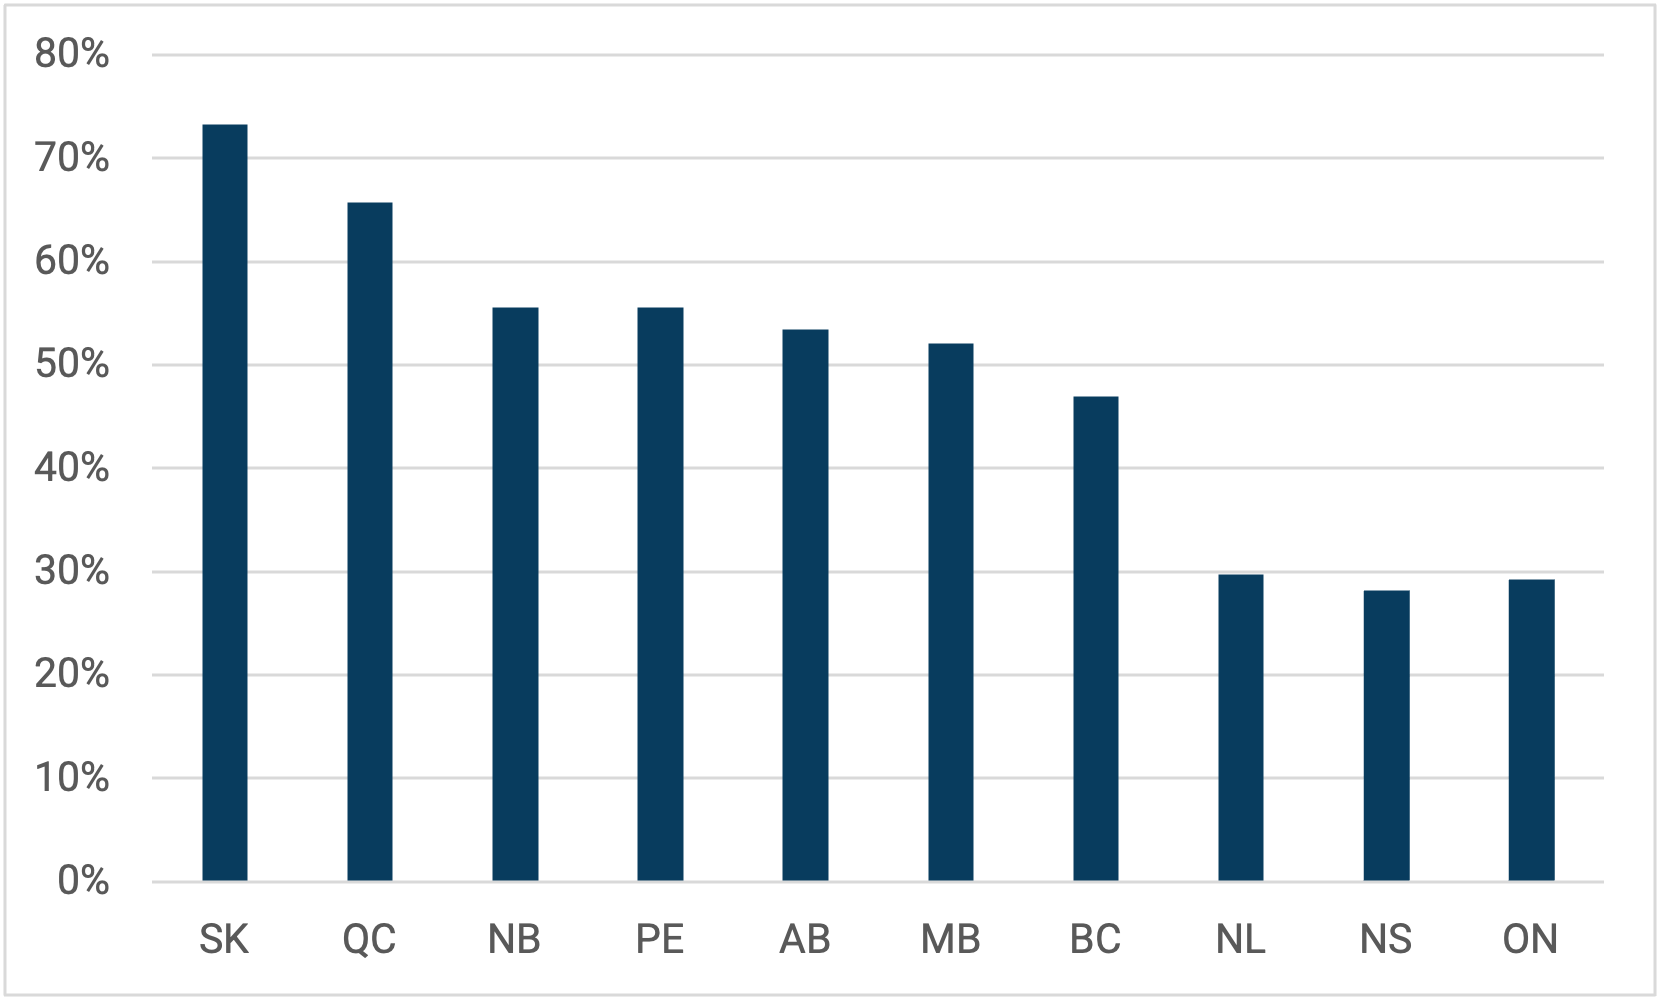
Table 1 shows each province’s biggest “trading partners” for students. Newfoundland, for instance, received more students from Ontario (327 students in 2023-24) than from any other province; however, Nova Scotia is the most common destination for Newfoundlanders (459 students headed there). As it turns out, the top partner in every category is either a neighbouring province (easy to get to/from) or Ontario (by far the largest pool of students and institutions available).
Table 1: Biggest Sending/Receiving Provinces for Out-of-Province Students, by Province, 2023-24
| Province | Receives Most Students From | Sends Most Students To |
| Newfoundland & Labrador | Ontario (327) | Nova Scotia (459) |
| Nova Scotia | Ontario (5,016) | Ontario (1,313) |
| Prince Edward Island | New Brunswick (198) | Nova Scotia (516) |
| New Brunswick | Nova Scotia (1,068) | Nova Scotia (1,881) |
| Quebec | Ontario (6,705) | Ontario (7.080) |
| Ontario | British Columbia (11,565) | Quebec (6,705) |
| Manitoba | Ontario (438) | Ontario (1,419) |
| Saskatchewan | British Columbia (1,545) | Alberta (1,833) |
| Alberta | British Columbia (3,921) | British Columbia (6,465) |
| British Columbia | Ontario (4,611) | Ontario (11,565) |
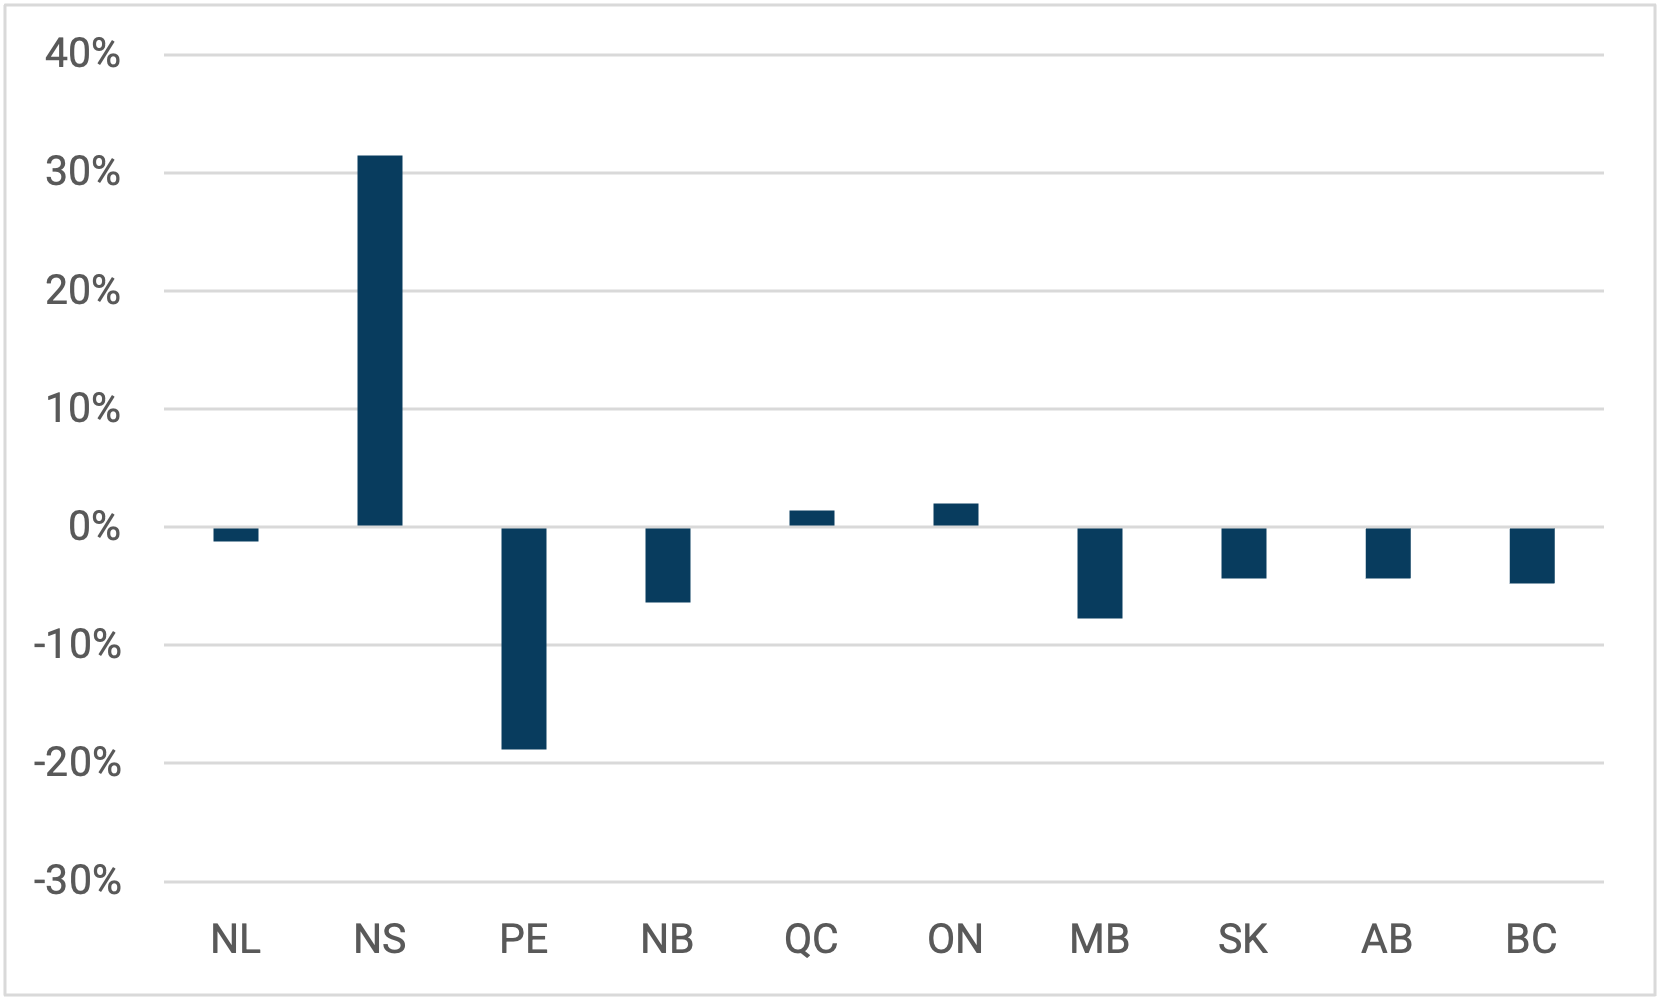
Figure 4 shows the “net” flow of students to and from each province; that is the number of income students minus the number of outgoing students. Only three provinces are net importers of students: Nova Scotia, Quebec and Ontario. All the others are net exporters to some degree. Figure 5 shows the same data as a percentage of the total number students studying in that province. Despite having identical numerators to figure 4, it looks quite different. On a percentage basis, Nova Scotia far and away hosts the most out-of-province students, and while Ontario has the most out-of-province in absolute terms, in percentage terms it is absolutely trivial. On the other end of the spectrum, Manitoba is the biggest “loser” of students, though New Brunswick is not far behind.
Figure 4: Net Student Flow, by Province, 2023-24
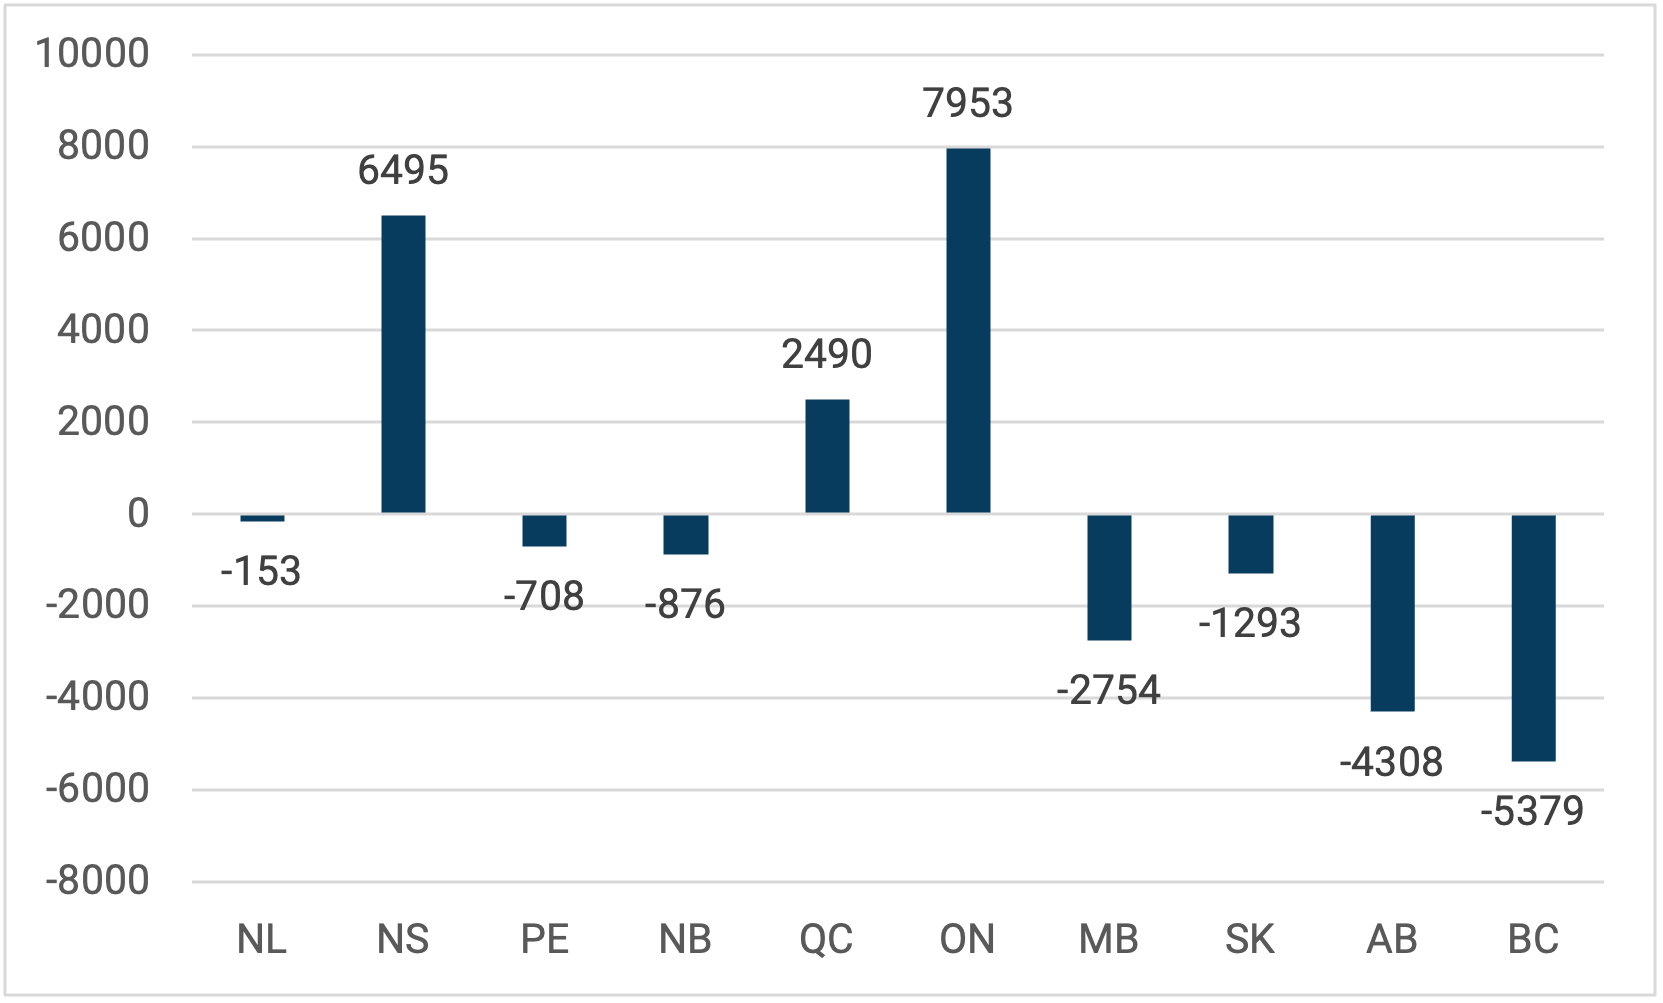
Figure 5: Net Student Flow as a Percentage of Domestic Students, by Province, 2023-24
That’s it. You now know as much about this topic as I do. Come back in five years or so and we’ll do this again.