




Morning all. A few years ago, I did a series of pieces on provincial higher education systems (for example, back here). I thought I would return to these five or so years later to see what has changed. I’ll be running these periodically over the next eight months or so, but I thought I would start today with BC – where there is a provincial election in a few days’ time – and head east from there.
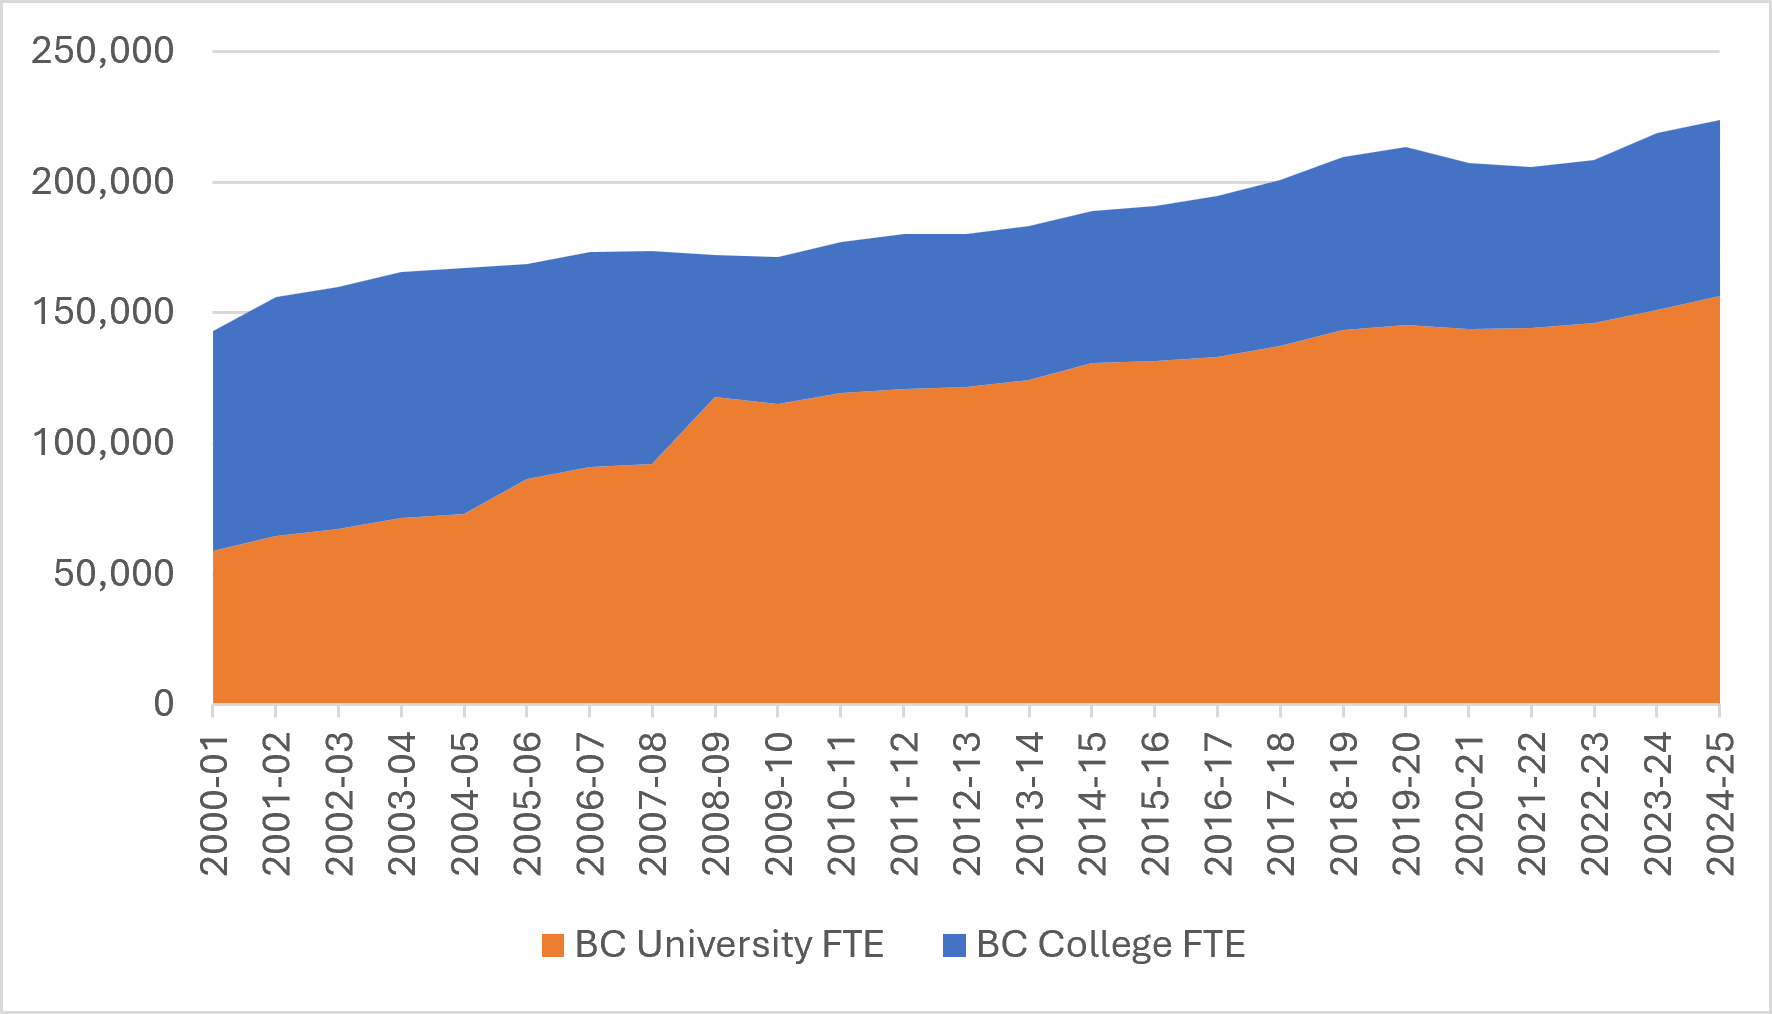
So, British Columbia. As figure 1 shows, overall enrollment in BC post-secondary institutions is up by about 56% since the turn of the century. The graph makes it appears as though most of the growth has been in universities, and that’s true in a sense, but the big shift in enrolments in the aughts was mostly due to five institutions (Emily Carr, Capilano, Kwantlen, Fraser Valley and Malaspina – now Vancouver Island University) having their designation switched from “college” to “university” by the provincial government. Fifty-six percent may sound by a lot, but BC actually trails the national average increase of 71%, meaning the province’s participation rates are actually falling further behind the national average. That’s somewhat troubling given that this is the country’s second-fastest growing province.
Figure 1: Enrolment by Institution Type, British Columbia, 2000-01 to 2024-25
Figures 2 and 3 show the percentage of international students in Brish Columbia’s college and university systems, respectively. (Note: the data runs out here just before the collapse in international student numbers, so this is enrolment at the peak rather than enrolment today.) British Columbia was probably the province most broadly exposed to the international student crisis. In the college sector, 35% of all students were international students, higher than any province except Ontario In the university sector, the equivalent was 28%, higher than any of the other big provinces, albeit somewhat lower than the 36% total in Prince Edward Island.
Figure 2: International Students’ Share of College Enrolment, British Columbia, 2000-01 to 2023-24
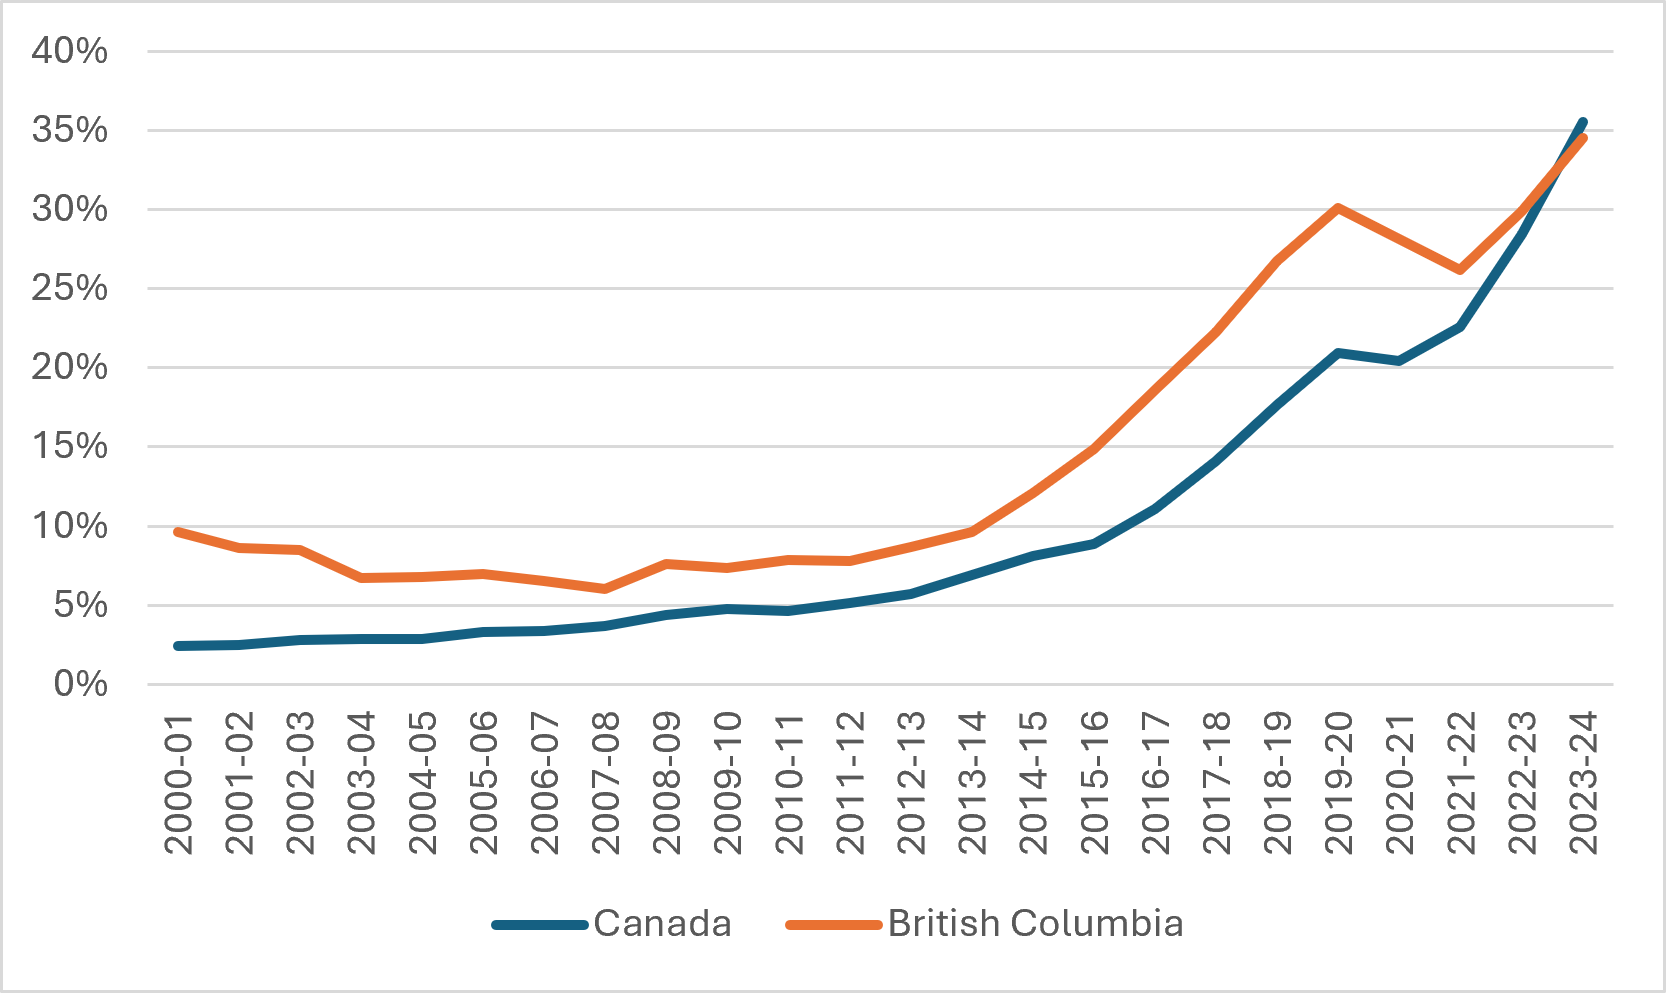
Figure 3: International Students’ Share of University Enrolment, British Columbia, 2000-01 to 2023-24
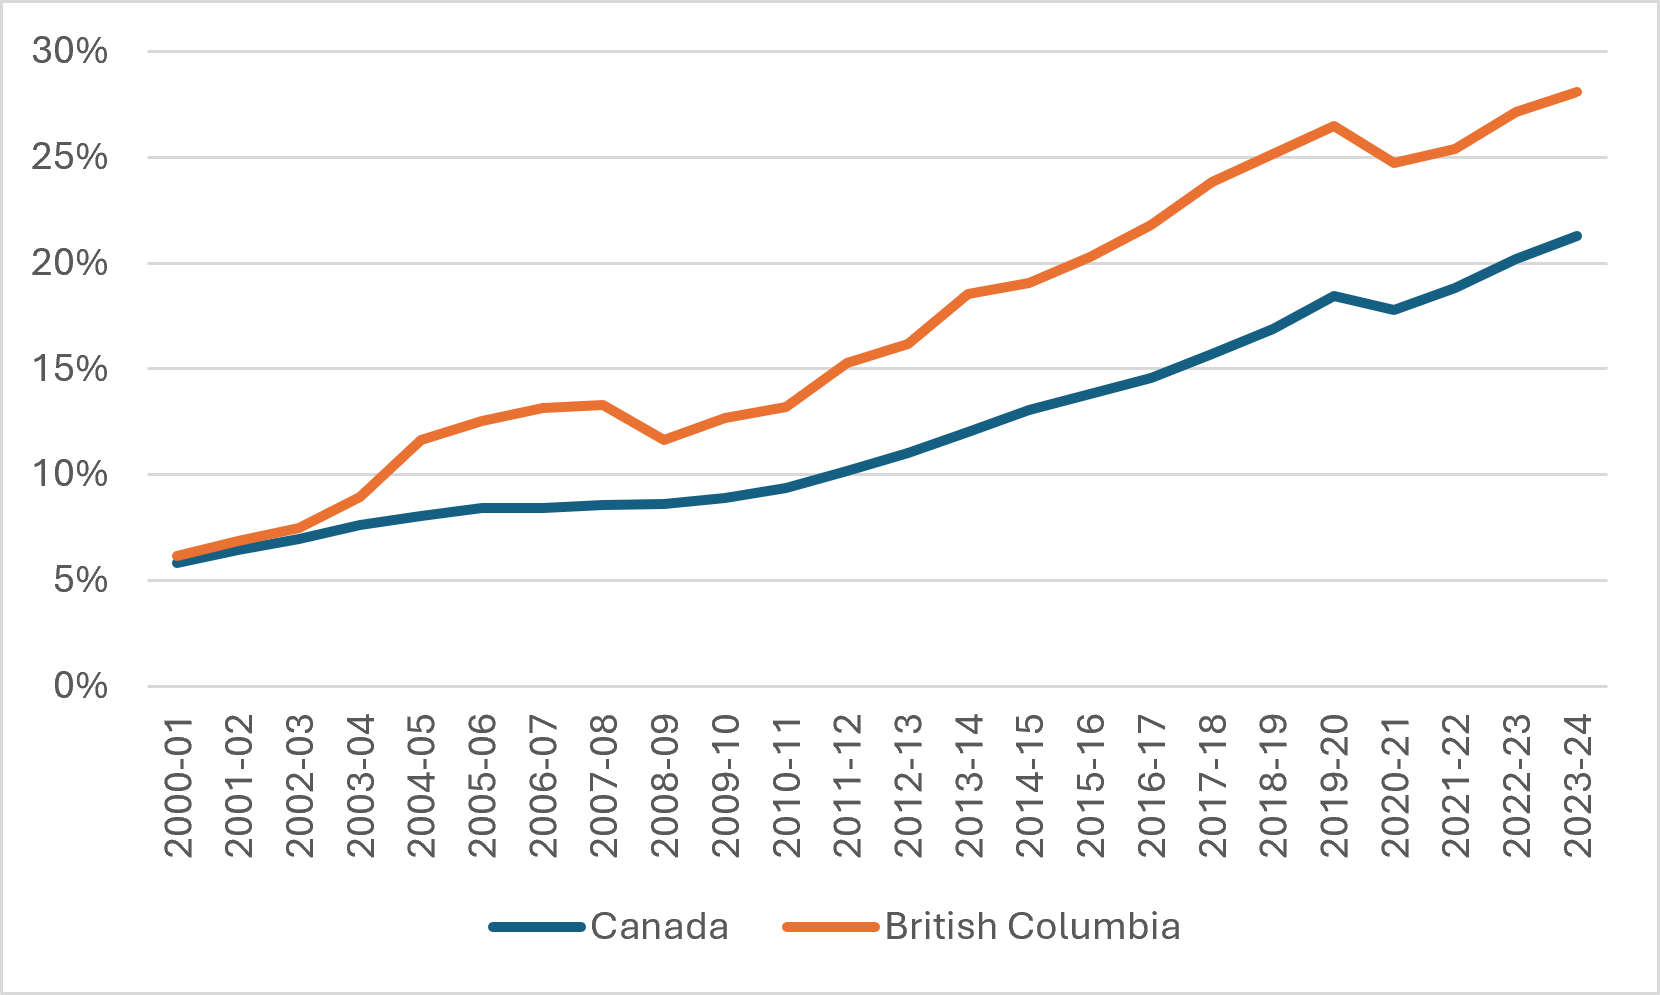
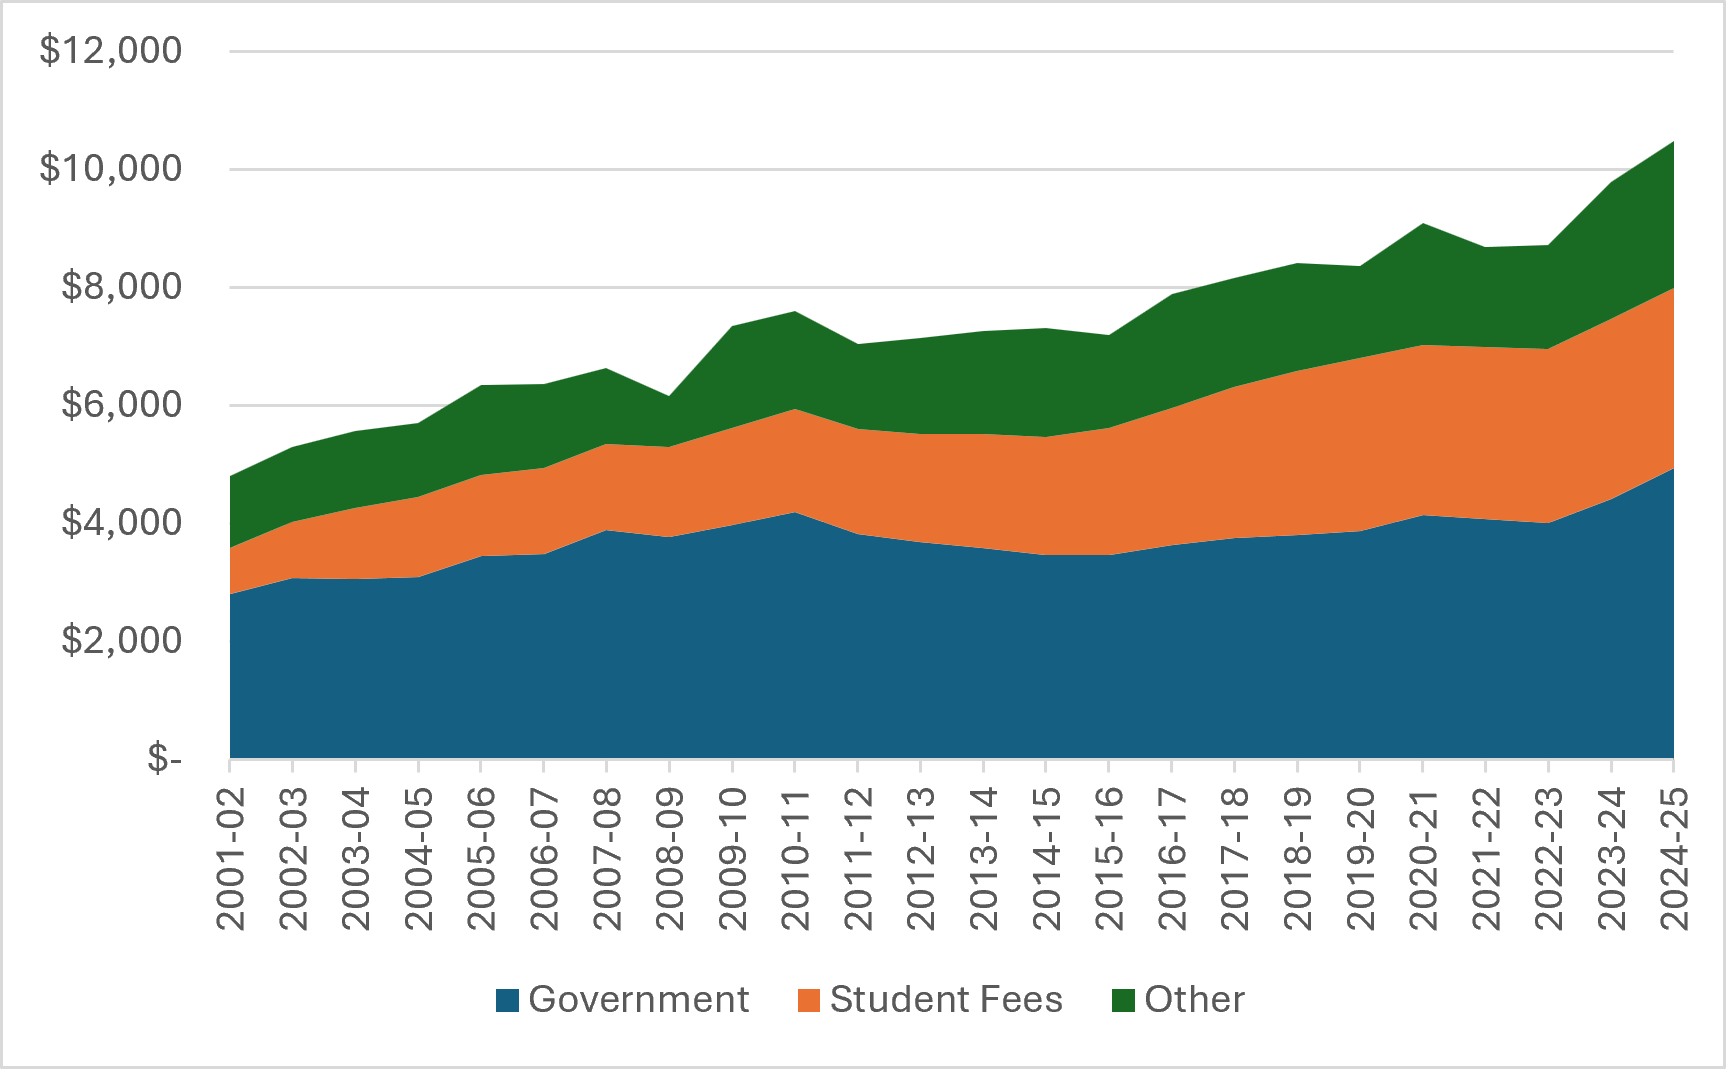
Figure 4 shows total institutional revenue over time and by source, in millions of constant 2024 dollars. Even after inflation, total sector revenue more than doubled from $4.8 billion to $10.5 billion (it’s almost certainly dropped since then because of the departure of international students). This is partly because the Eby government has been one of the few governments to increase investments in higher education in the past few years, but mainly because there were so many international student dollars running through the system. In total, institutional income rose by 118% between 2001-02 and 2024-25, which was the highest increase of any province in Canada.
Figure 4: Total revenue by source, BC Colleges and Universities, in Millions ($2024), 2001-2 to 2024-5
You can see British-Columbia’s best-funded-in-the-country status more easily when shown on a per-student basis, as below in figure 5. BC Colleges and universities essentially have had the best of both worlds: high student income from international student fees like Ontario, but also provincial government support more on par with the other eight provinces. Combined with a relatively small student population (see above), this means that British Columbia’s colleges have income per student about 22% higher than colleges in the rest of the country, and the universities have income about 26% higher than the rest of Canada.
Figure 5: Per-FTE Income by Institution-Type, BC vs. Rest of Canada, 2024-5
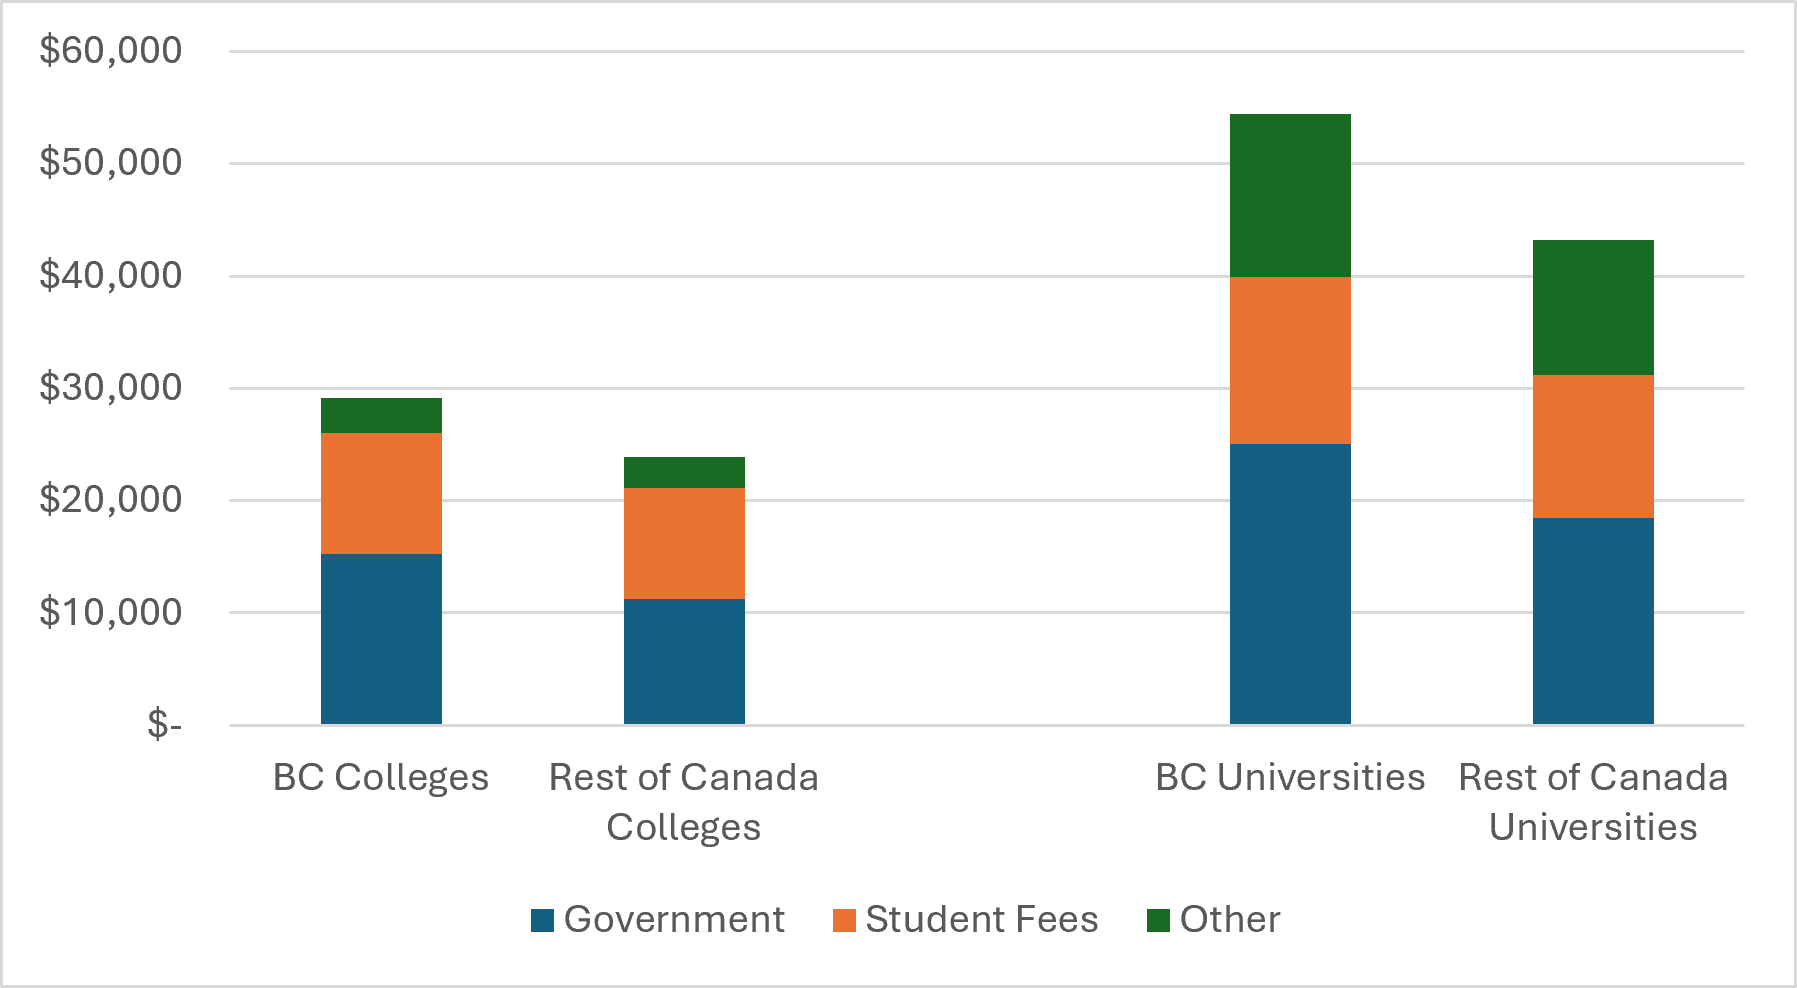
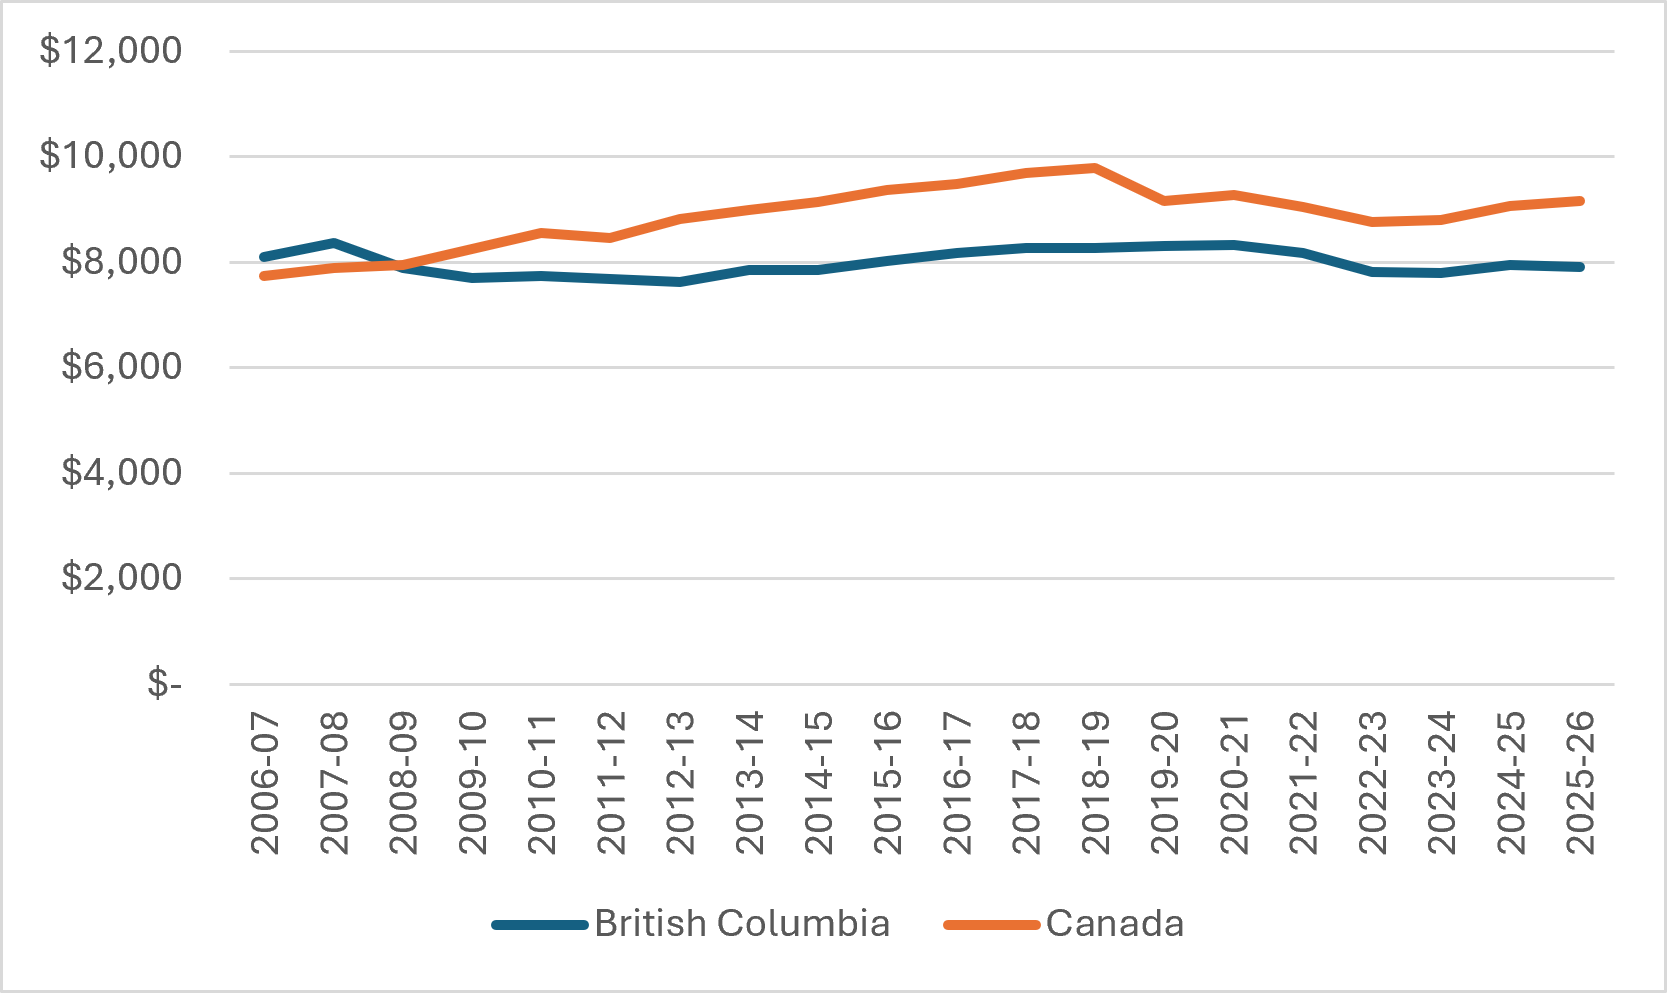
Figure 6 shows tuition fees in constant dollars, both for British Columbia and Canada. It’s not a particularly interesting graph because the relationship it shows is pretty stable: for the past two decades, annual domestic tuition fees have come under the national average by about $1,000 or so.
Figure 6: Domestic Undergraduate Tuition Fees in Constant Dollars, BC vs Canada, 2006-07 to 2025-26
And finally, there is figure 7, which shows student assistance (from provincial and federal aid programs combined) by type over time, and figure 8, which compares student aid across the whole country. The relative generosity of a student aid system is partly about the number of people it serves and partly about the amount of money it gives to students; these figures show aid by type as a percentage of gross domestic product instead of per-student, because that is the easiest and most accurate way to include both aspects of generosity into a single measure which is comparable across all provinces. Both in terms of total assistance provided and grant assistance provided, British Columbia has the least-generous student aid system of any of the provinces who are part of the Canada Student Financial Assistance Program (i.e. excluding Quebec), and it has been getting less generous over time.
Figure 7: Total Need-Based Student Assistance by Type as a Percentage of GDP, British Columbia, 2011-12 to 2024-25
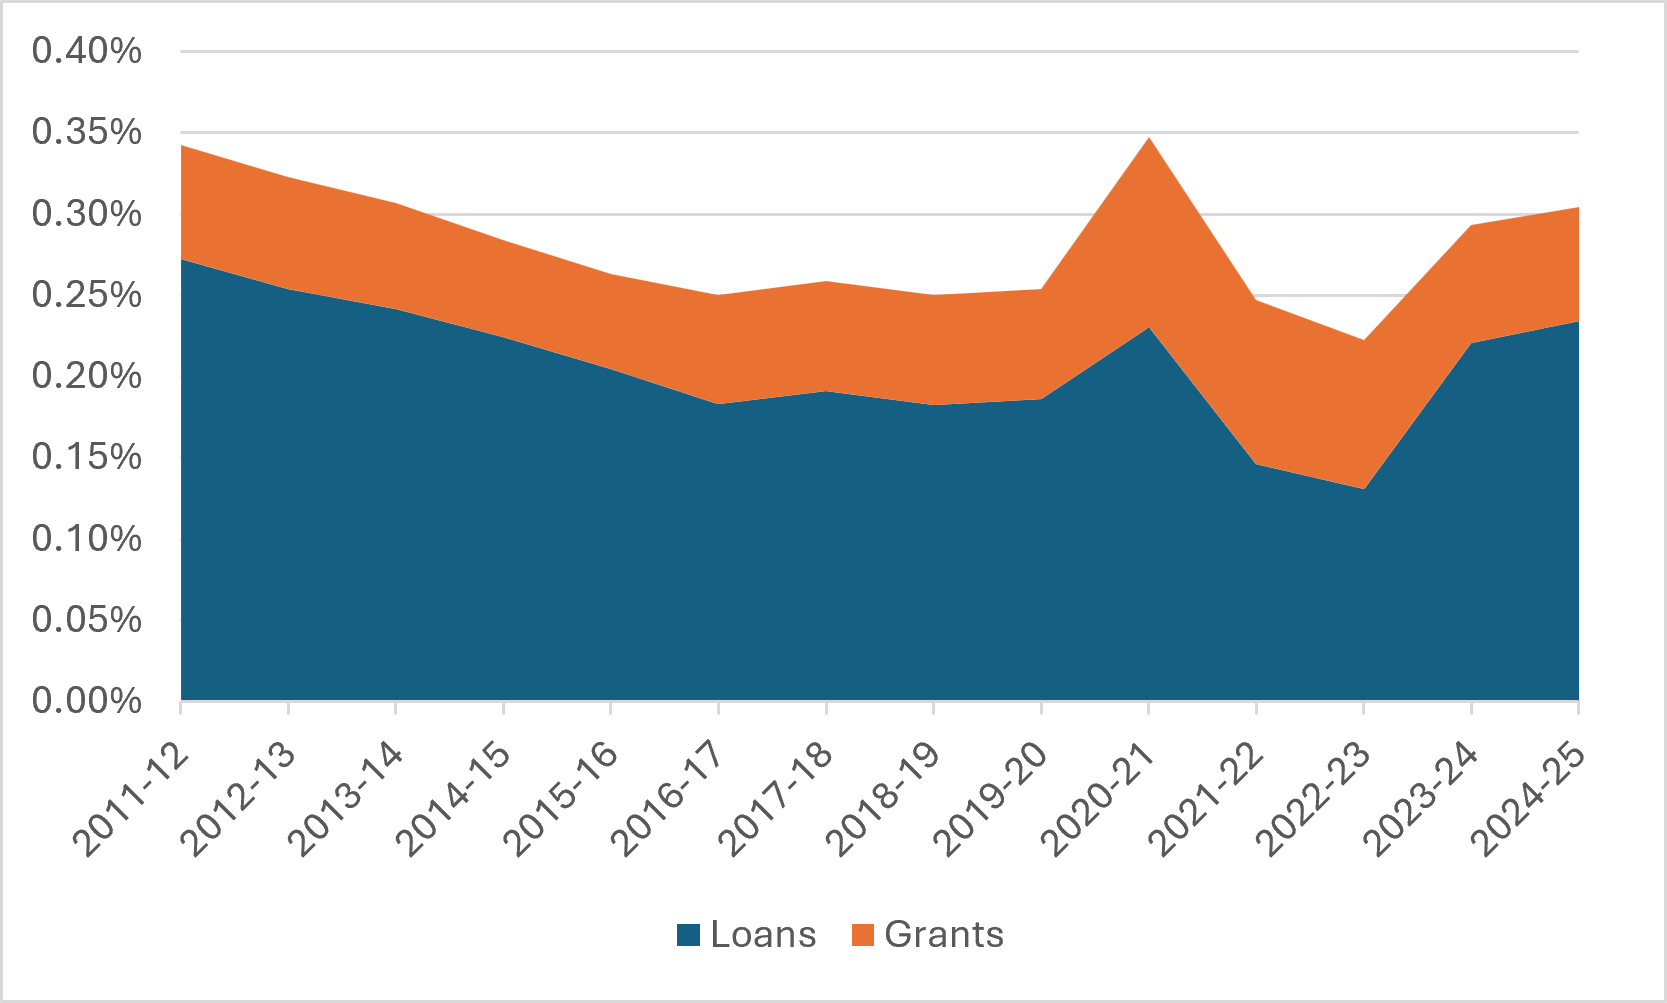
Figure 8: Total Need-Based Student Assistance by Type as a Percentage of GDP, by Province, 2024-25
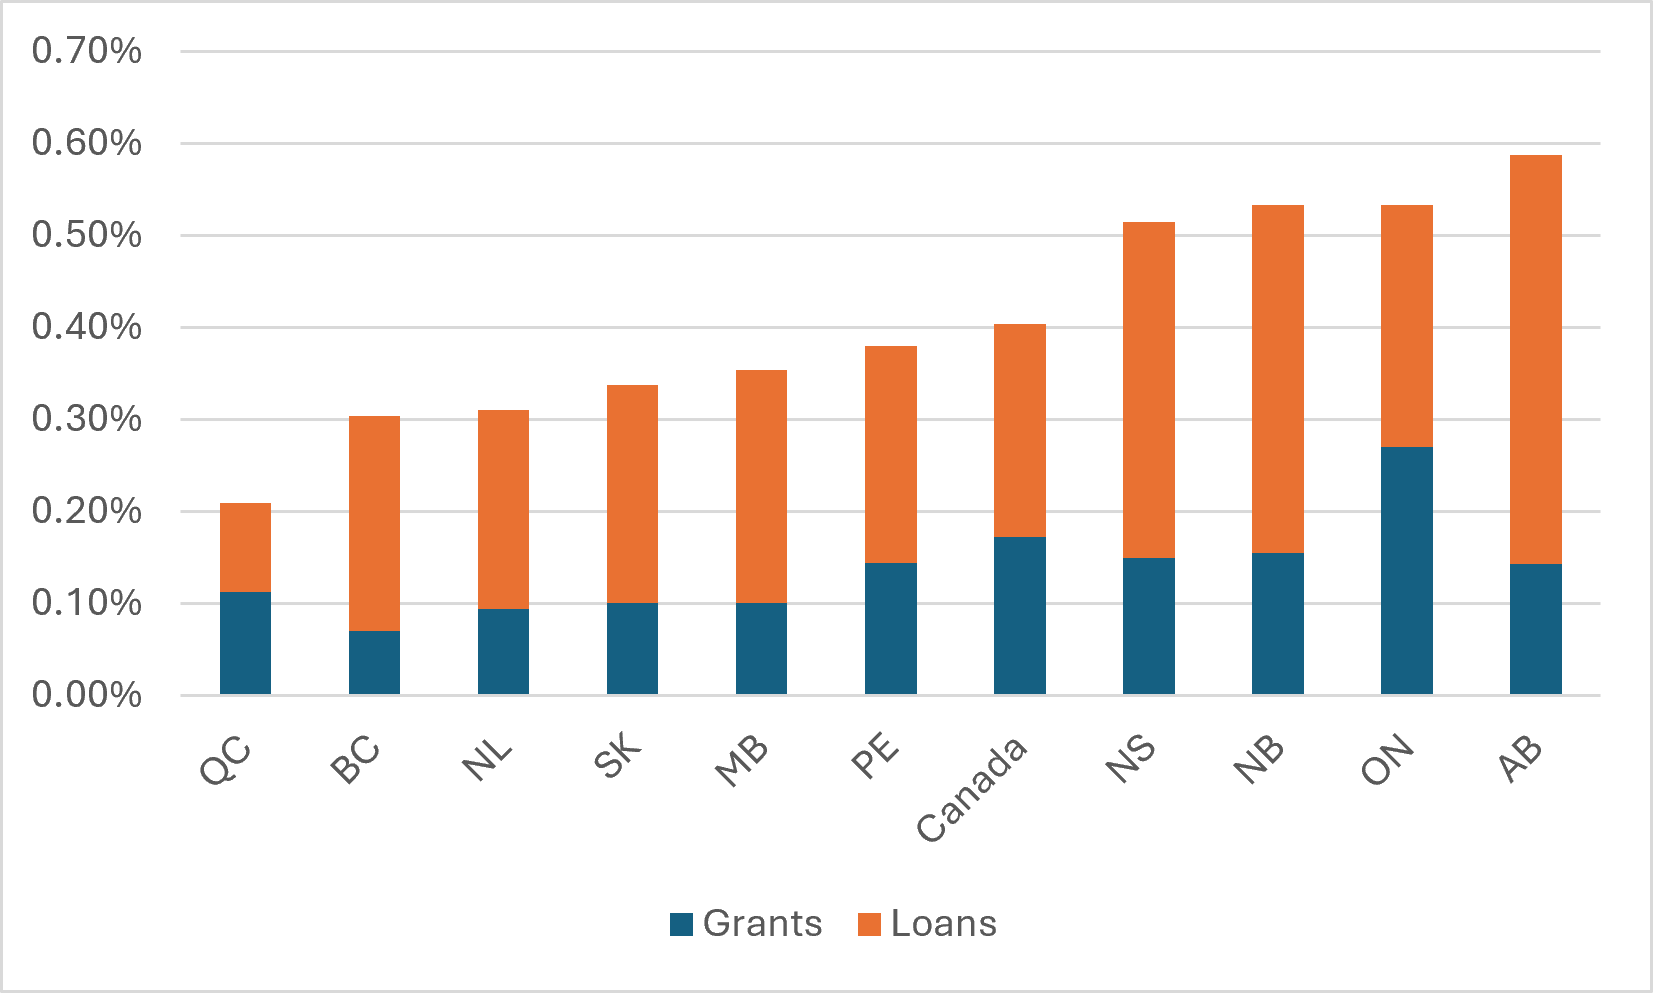
So, there you have it. In some ways, it’s easiest to think of British Columbia in 2024-25 as having been the exact opposite of Ontario: best-funded institutions versus worst-funded institutions, but also worst-funded student aid system versus best-funded student aid system (at the time). What both had in common, of course, was an over-reliance on international student aid. And both have been rocked by reductions to that income over the last two years.
But here’s the difference: the province of Ontario is increasing spending on post-secondary education while the odds are that British Columbia, with a provincial deficit about three times larger than Ontario on a per-capita basis, is going to be cutting in the very near future. When we come back and do this again in four or five years, my guess would be that BC won’t look so good on government funding and international student funding but will have higher domestic tuition fees and (fingers crossed) student aid.