

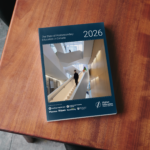



Morning all. The State of Post-Secondary Education in Canada 2026 is out today, and you can download it here. Sincere thanks to our partners at Studiosity, Riipen, Pearson, Duolingo, Intellectual Property Ontario and Westcliff University for helping to produce this year’s version and keep it free for everyone to use. Anything you want to know about Canadian post-secondary education should be in here – but if it’s not, email us and tell us what you think we should add next year.
Now you might think that a volume with the title The State of Post-Secondary Education in Canada 2026 might be nothing but gory details about the drop in international student numbers and scary financial outcomes. But as my co-authors (Jiwoo Jeon and Janet Balfour) and I discovered as we combed through the latest data, the disaster story just isn’t there. Or perhaps more accurately: it’s everywhere except the statistics. Canada’s postsecondary data system simply isn’t quick or comprehensive enough to yet show any significant effects of the international student visa policy change that occurred (as of today) 961 days ago.
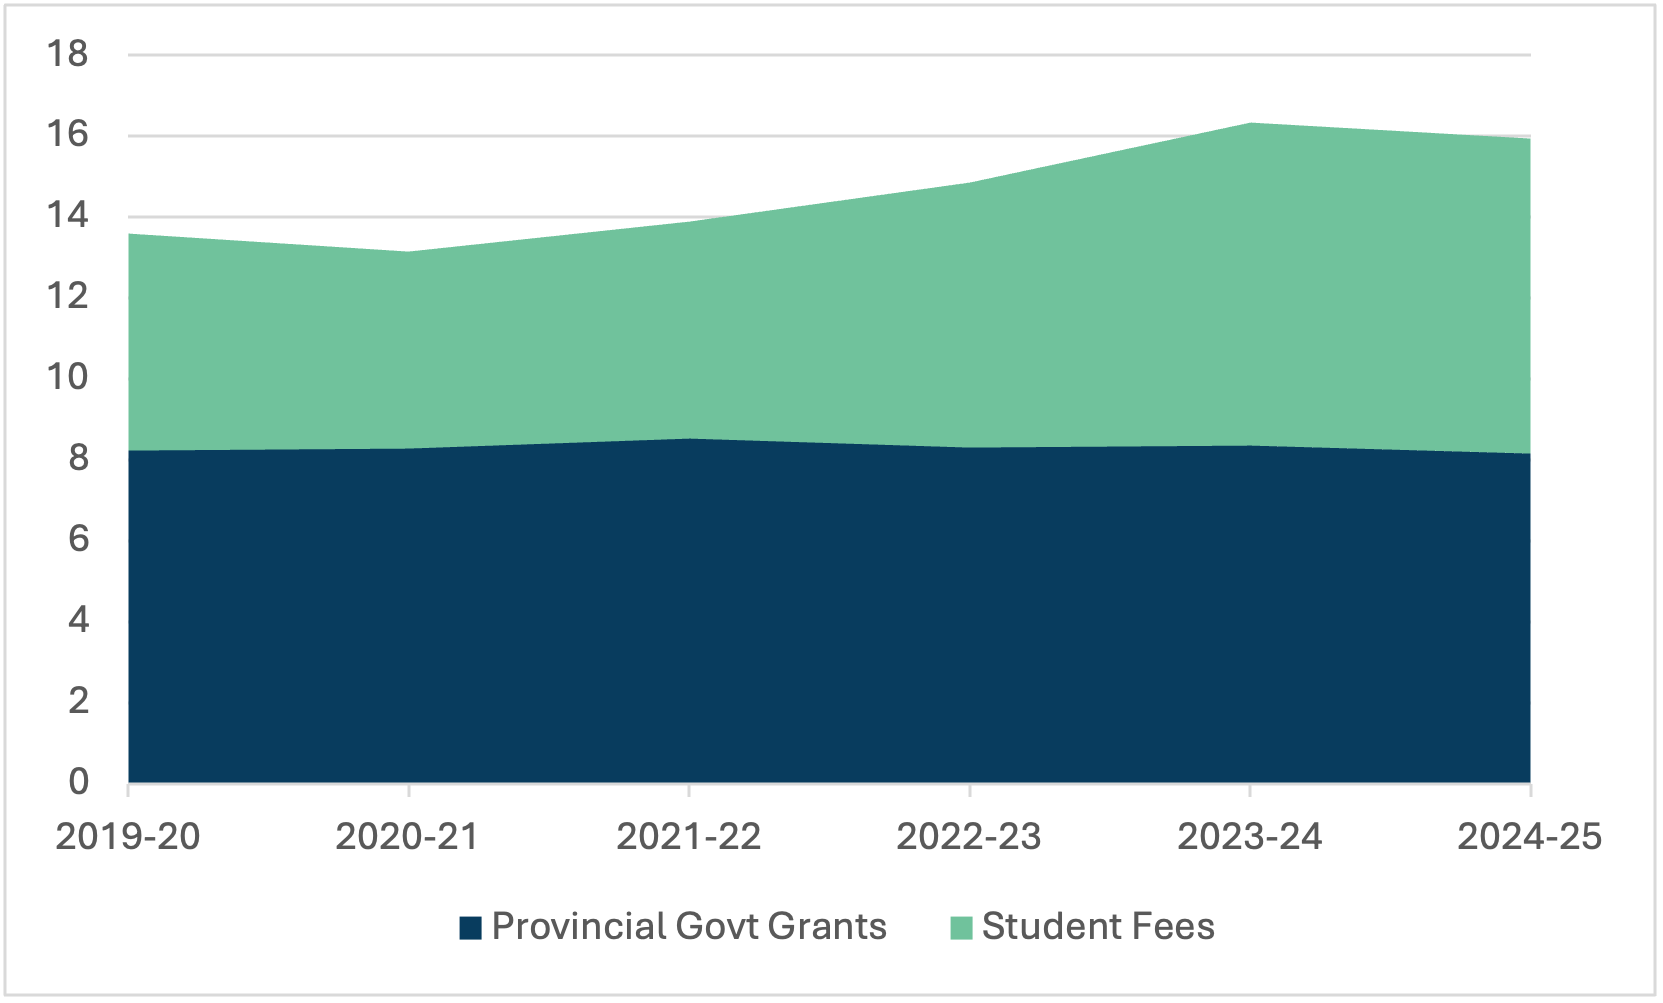
Seriously: take a look at figures 1 and 2. Crisis? What crisis?
Figure 1: University Operating Income by Source, Canada, 2019-20 to 2024-25, in Billions, $2024
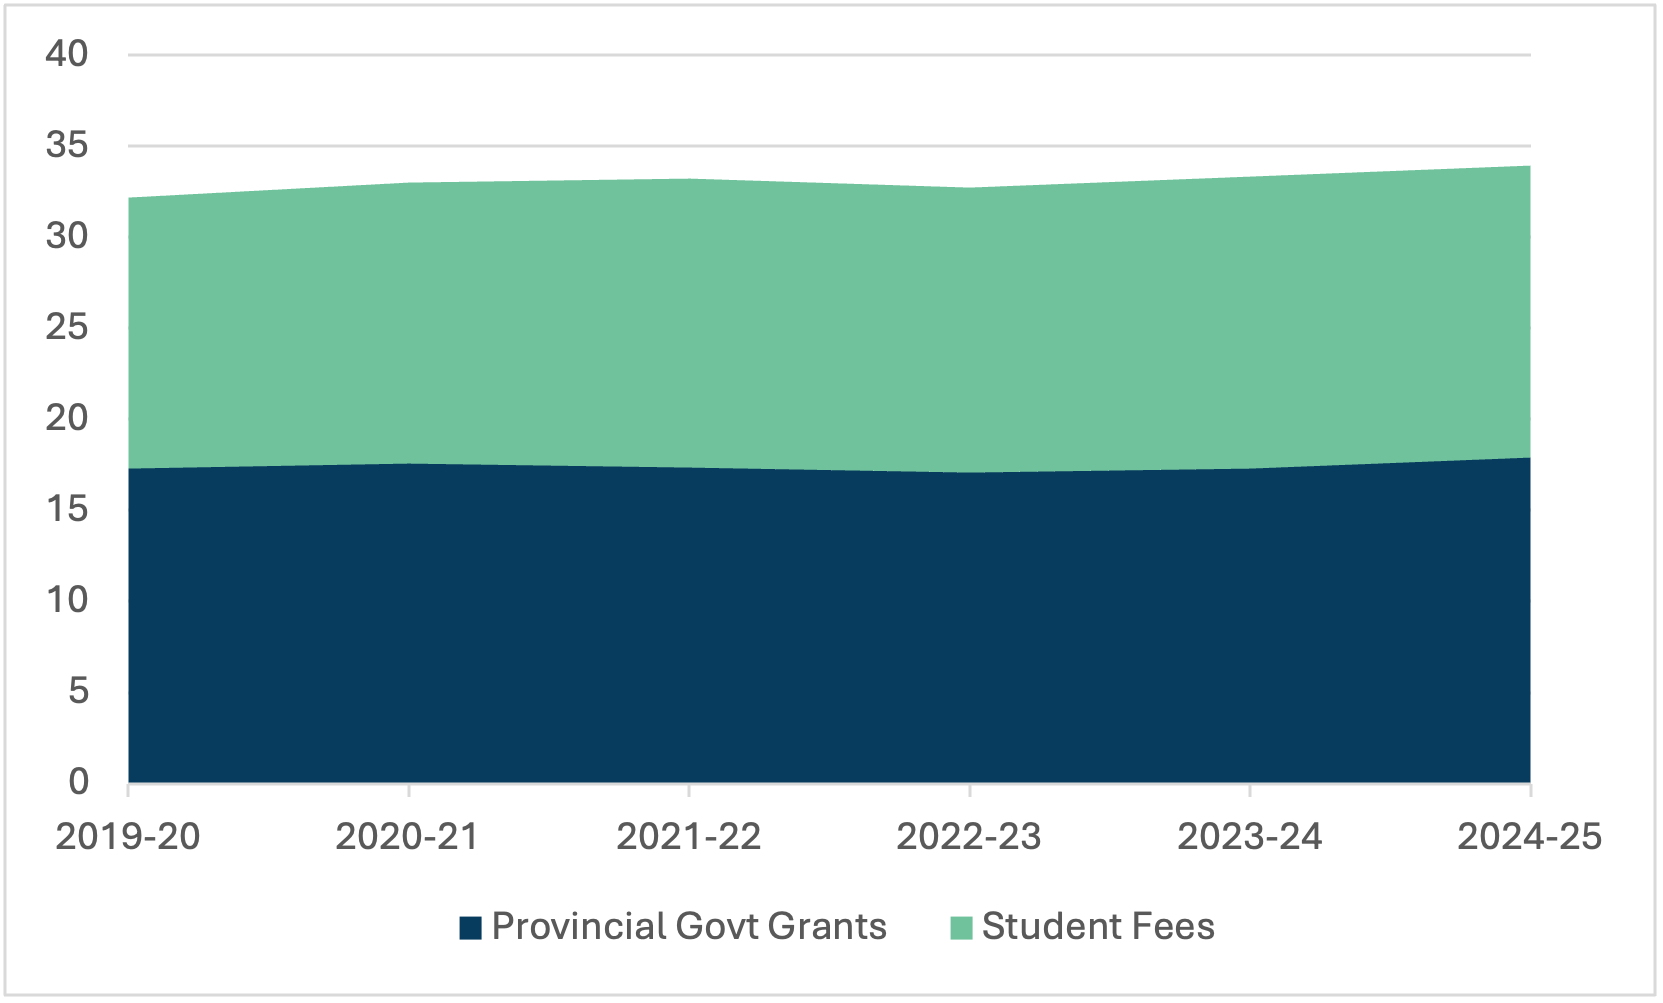
Figure 2: College Operating Income by Source, Canada, 2019-20 to 2024-25, in Billions, $2024
To get any data beyond early 2025, we have to rely on what individual institutions have published about their own finances. At the time of writing, financial statements have been published by about half of the country’s universities (albeit with major gaps in Ontario and Québec). On the college side, Ontario and British Columbia are relatively complete, but data from elsewhere is nearly entirely missing. The news from BC isn’t good (income fell 7% system-wide), but I am going to focus on Ontario because the data is so jaw-dropping.
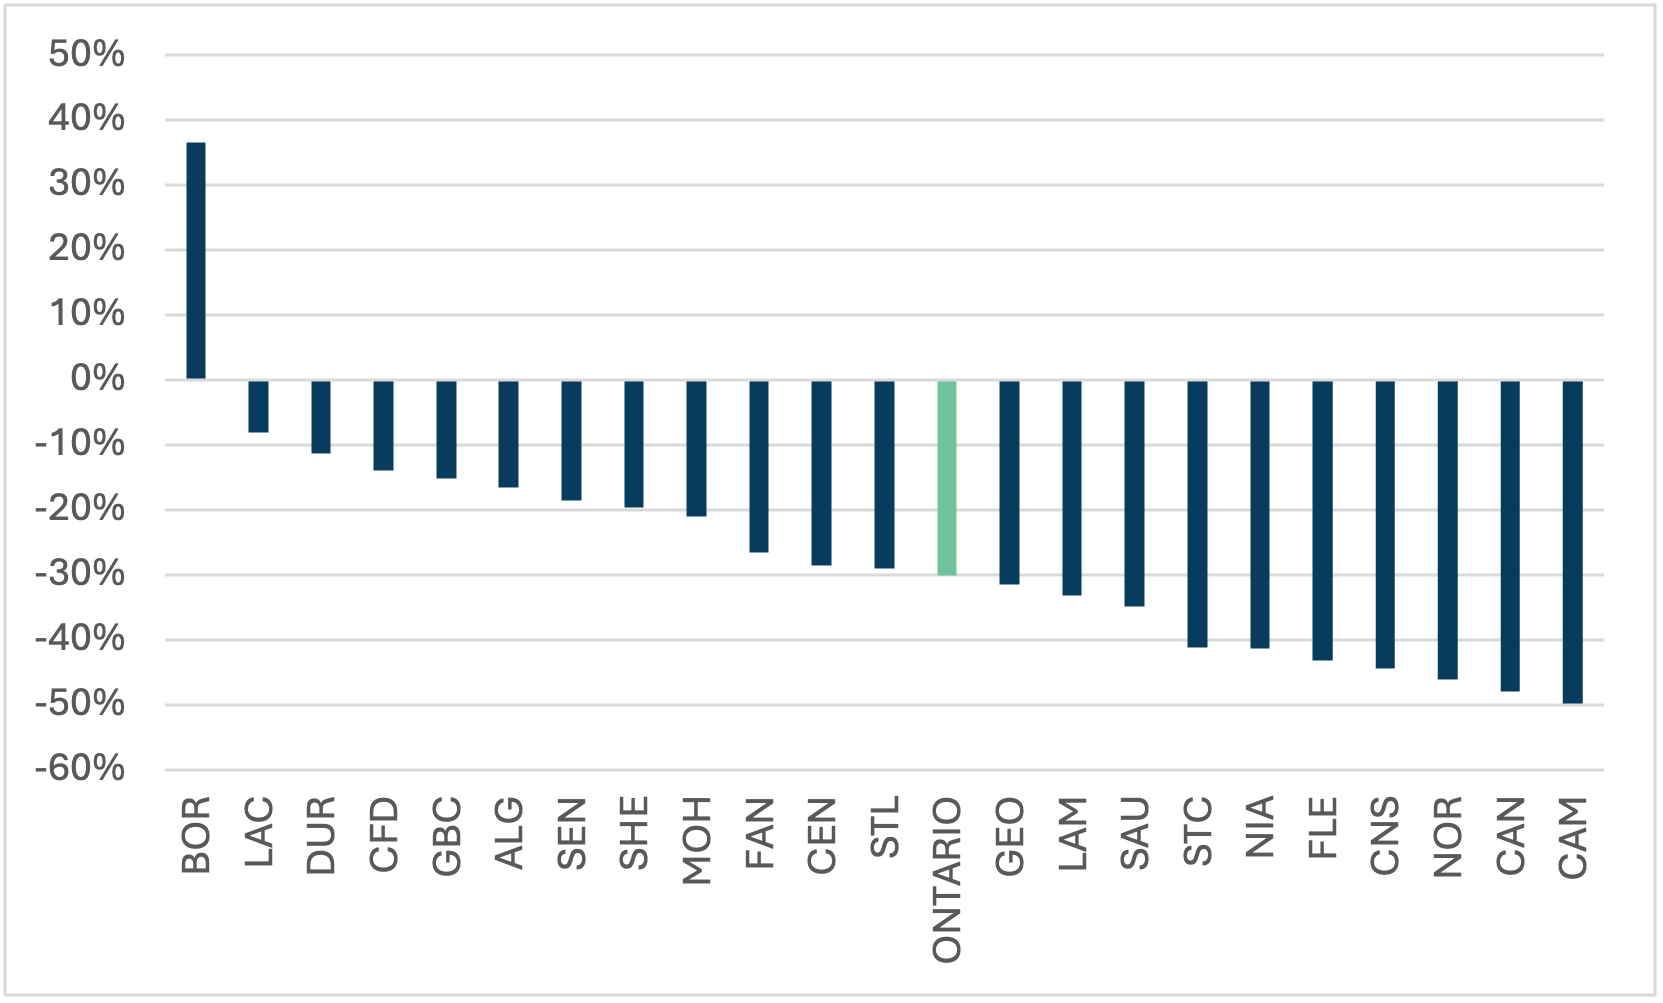
Figure 3 shows the one-year change in income at individual Ontario colleges from 2024-25 to 2025-26. With the sole and quite astonishing exception of Collège Boréal (it’s mostly a big influx of government money, but it was also the only college in the province to see fee income increase last year…Daniel Giroux for President of the year?), the impact of the federal visa changes was absolutely savage. In 2025-26, system-wide fee income fell by 41%, and total income fell by $2.3 billion, or 30%. Roughly two-thirds of this revenue loss was absorbed by reducing expenditures; the remainder was absorbed by allowing institutional financial positions to erode. The system as a whole went from an 8% net surplus to a 3% net deficit. Some of that loss will have to be made up through cuts implemented in future years; the rest presumably by institutions simply surviving with much smaller financial margins than they did in the past.
Figure 3: Change in Total Income, Ontario Colleges, 2024-25 to 2025-26
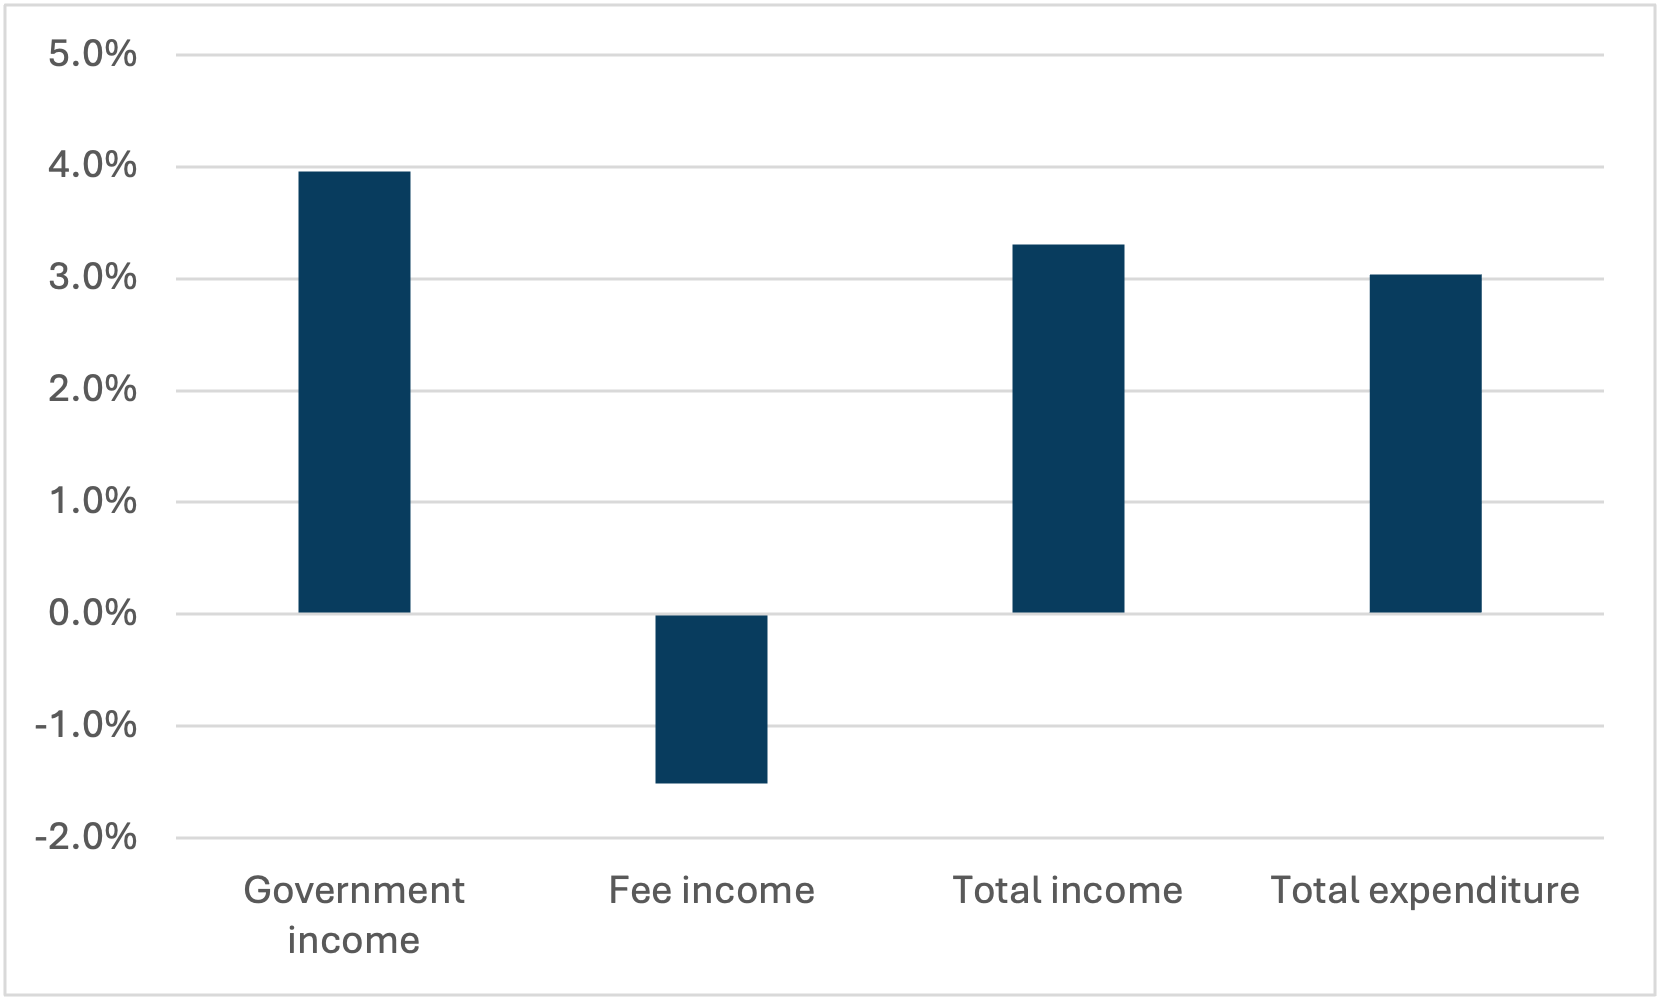
The university results are perhaps a bit more surprising. As Figure 4 shows, among those institutions for which we have data for both 2024-25 and 2025-26, both total income and total expenditure actually rose, even as income from student fees fell (note: fee income here is fees from all students, so the drop in international student fee income is probably larger than this, probably by a factor of 2x). Partly, this result reflects an increase in provincial government expenditures, as documented in Chapter 4 of this report. Perhaps more to the point, it suggests that universities have yet to really feel the full extent of the impact of the drop in international student numbers. (Note: these numbers are likely to change somewhat as more institutions report).
Figure 4: One-Year Change in Financial Results, Reporting Canadian Universities, from 2024-25 to 2025-26
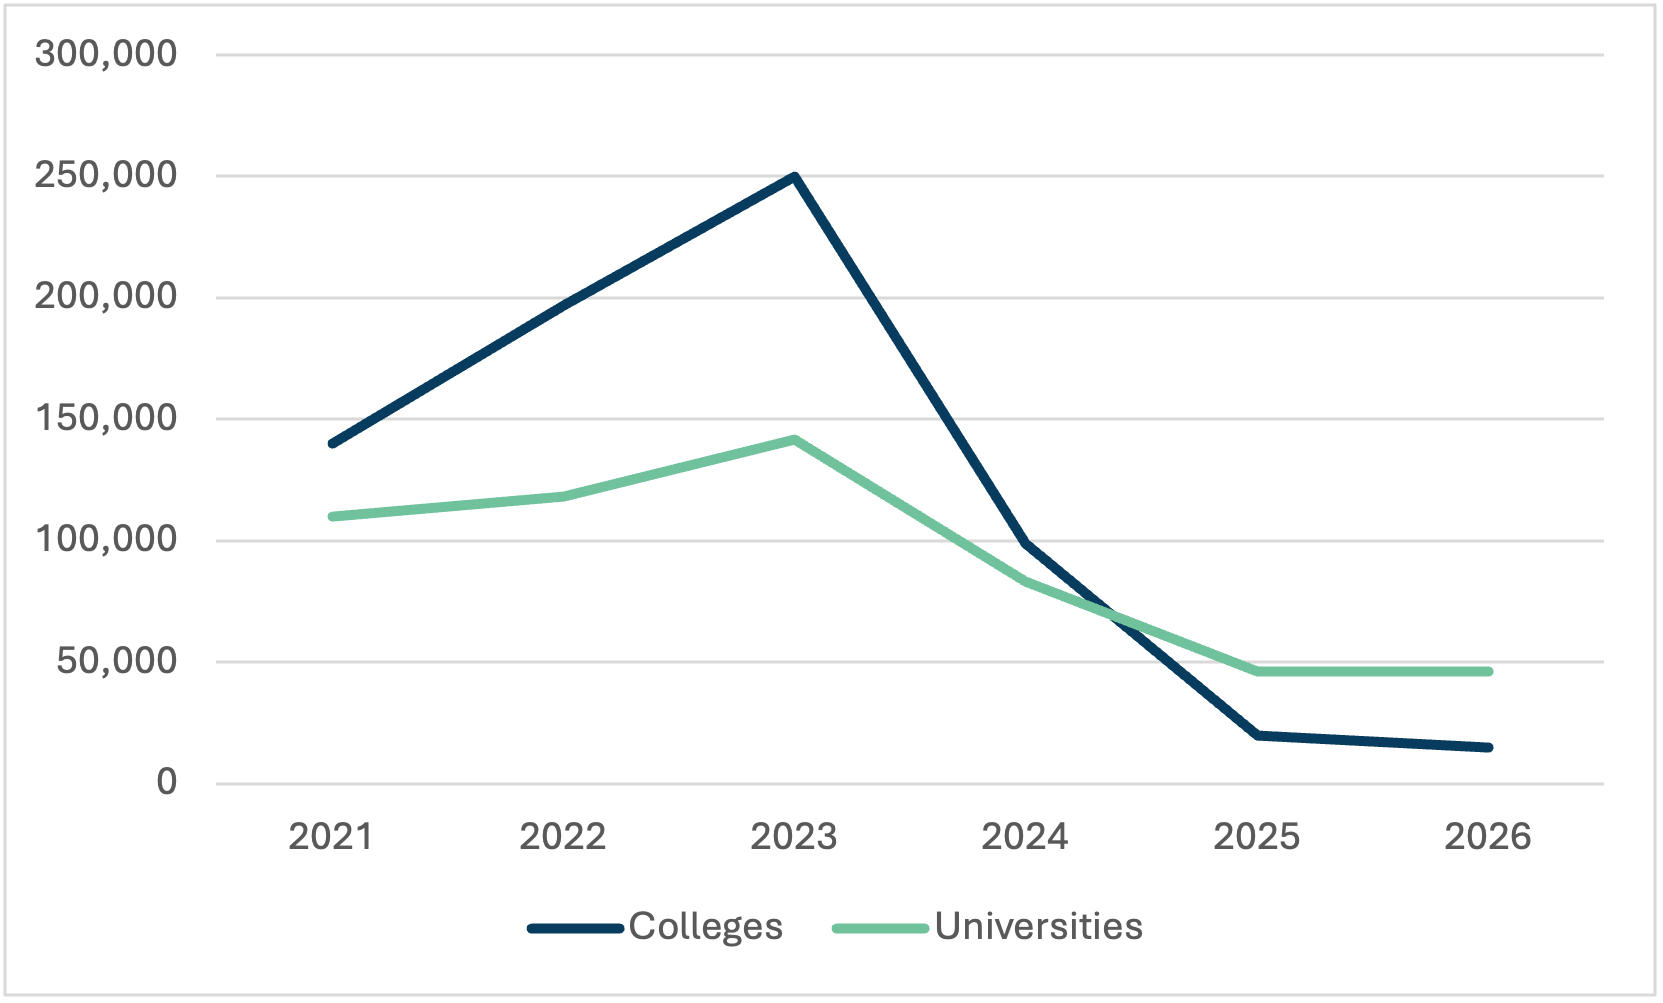
To understand how the impact of the federal cap on student visas impacts colleges and universities differently over time, we need to take a deeper dive into what has happened to visa approvals over the past few years. Figure 5 shows the number of new visas approved by the Government of Canada, by sector, from 2021 to 2026 (the Government does not routinely publish data at this level of disaggregation: the data is courtesy of ApplyBoard). In this graph, 2026 is an imputed value based on year-to-year comparisons for the months of January to June with those of the previous year. As is plain, both the run-up and the collapse in visa numbers impacted the college sector much more than the university sector. Between 2023 and 2025, visa approvals for universities fell by two-thirds, but for colleges the drop was nearly 95%.
Figure 5: New Student Visa Approvals, by Institution Type, Canada, 2021-26
But remember: these figures are for new student arrivals, not total student numbers. It takes some time for changes in the number of new students to affect total student enrolment numbers, for the simple reason that it takes time for students to graduate. It is impossible to know from existing public data exactly how long this takes, but a reasonable assumption given different program lengths is about three years on average in universities and about a year and a half in colleges, with some taking less time and others taking longer. In full, it could take up to six years for a decline in new international students to work its way fully through the system.
With these reasonable assumptions about student attrition and completion, and assuming that the 2025-26 numbers become a “new normal,” it is possible to estimate how international student numbers will evolve over the rest of the decade. Figure 6 shows the total number of international students in colleges and universities from 2023-24 out to 2030-3. As can be seen, the effects of new visa reductions occur much more quickly in colleges than in universities. This is not just because of the larger drop in visa approvals, but also because of colleges’ shorter program lengths. According to this estimate, total numbers in colleges dropped by 60% in the first two years after the visa changes, while on the university side it will take six years to fall the same distance.
Figure 6: Indexed Estimated International Student Numbers, 2023-24 to 2030-31, 2023-24 = 100
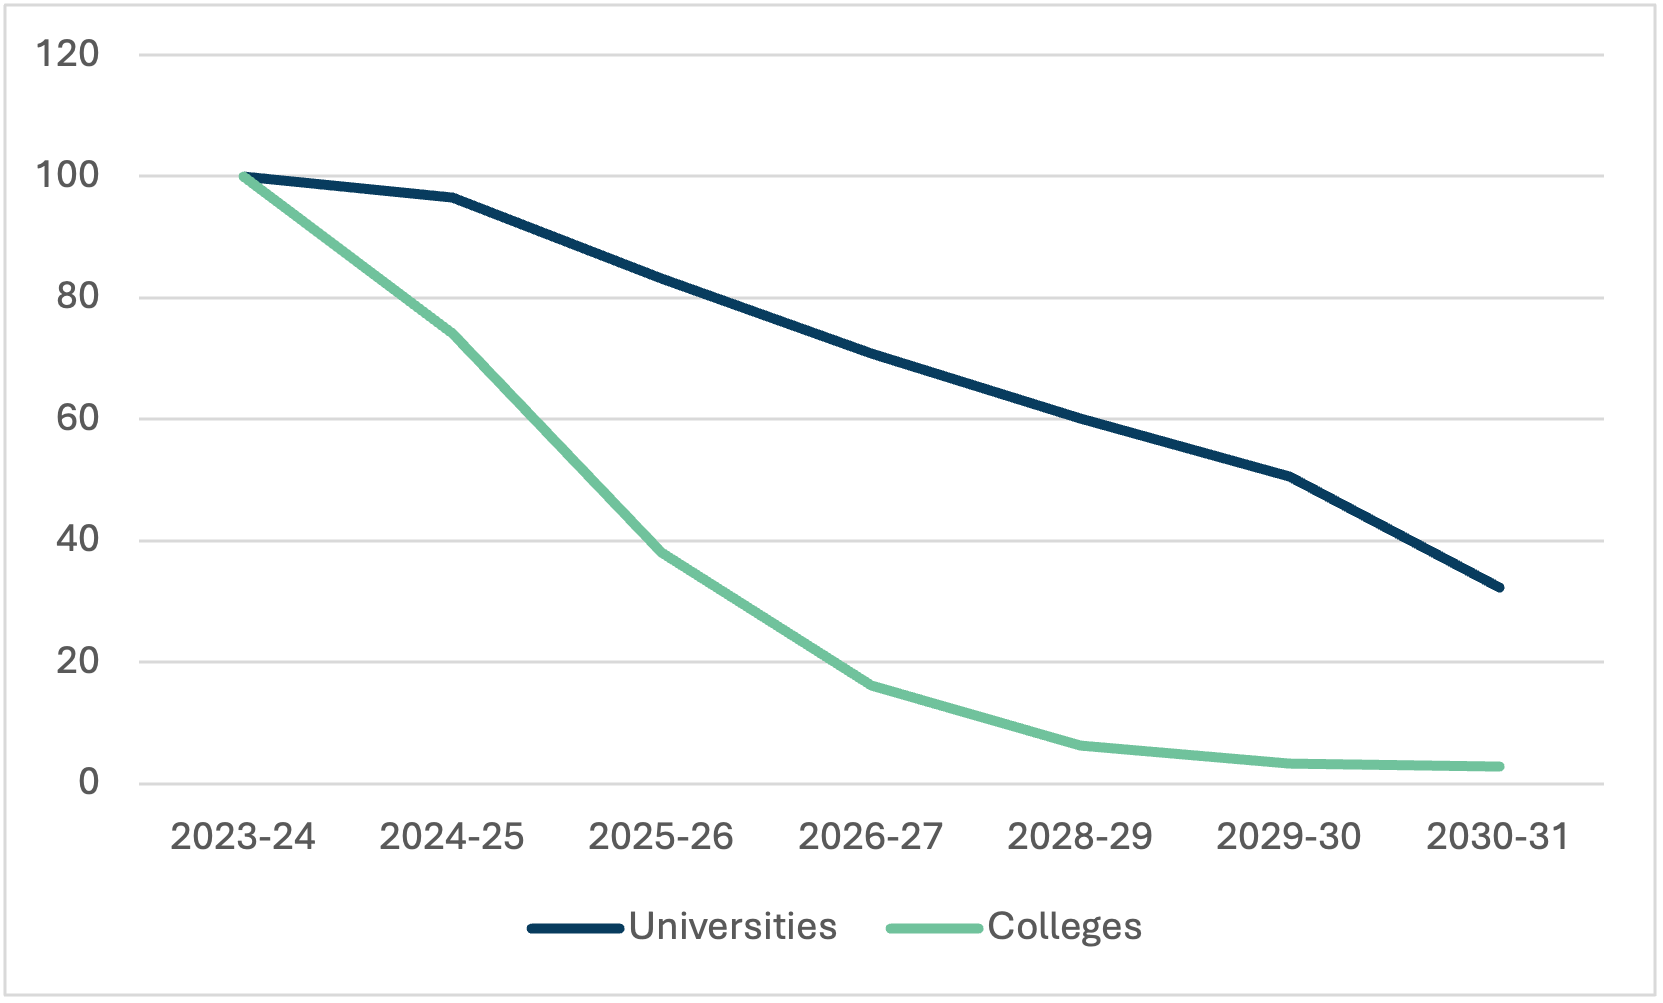
(Figure 6 is of course entirely a product of the above-mentioned reasonable assumptions. If, in fact, students leave universities faster than this, then the university and college lines would look similar. Another confound here is that visa years, fiscal years, and academic years don’t line up, and sometimes the data looks reasonable with one lens but not another. The basic point here though is that while we can argue about the steepness of the slopes, there’s no doubt about the end-points.)
In any event, it is a relatively simple matter to apply the data from Figure 6 to existing estimates of institutional revenue from international student tuition fees and include a future rise in international student fees consistent with those seen in the past couple of years. In 2023-24, these sums amounted to about $8.4 billion for universities and $5.5 billion for colleges, with about 70% of the latter concentrated in Ontario. Figure 7 shows how changes in international student enrolment will affect these figures. The estimated $3 billion drop in 2023-26 for colleges is fairly consistent with data presented in Figure 3 above. That means the worst is over; however, nationally, the sector is still likely to experience another $1 billion fall in revenue in 2026-27 and another $500 million in 2027-28 as the final remnants of the boom cohorts depart.
Figure 7: Projected Income from International Students, 2023-24 to 2030-31, in Billions, $2025
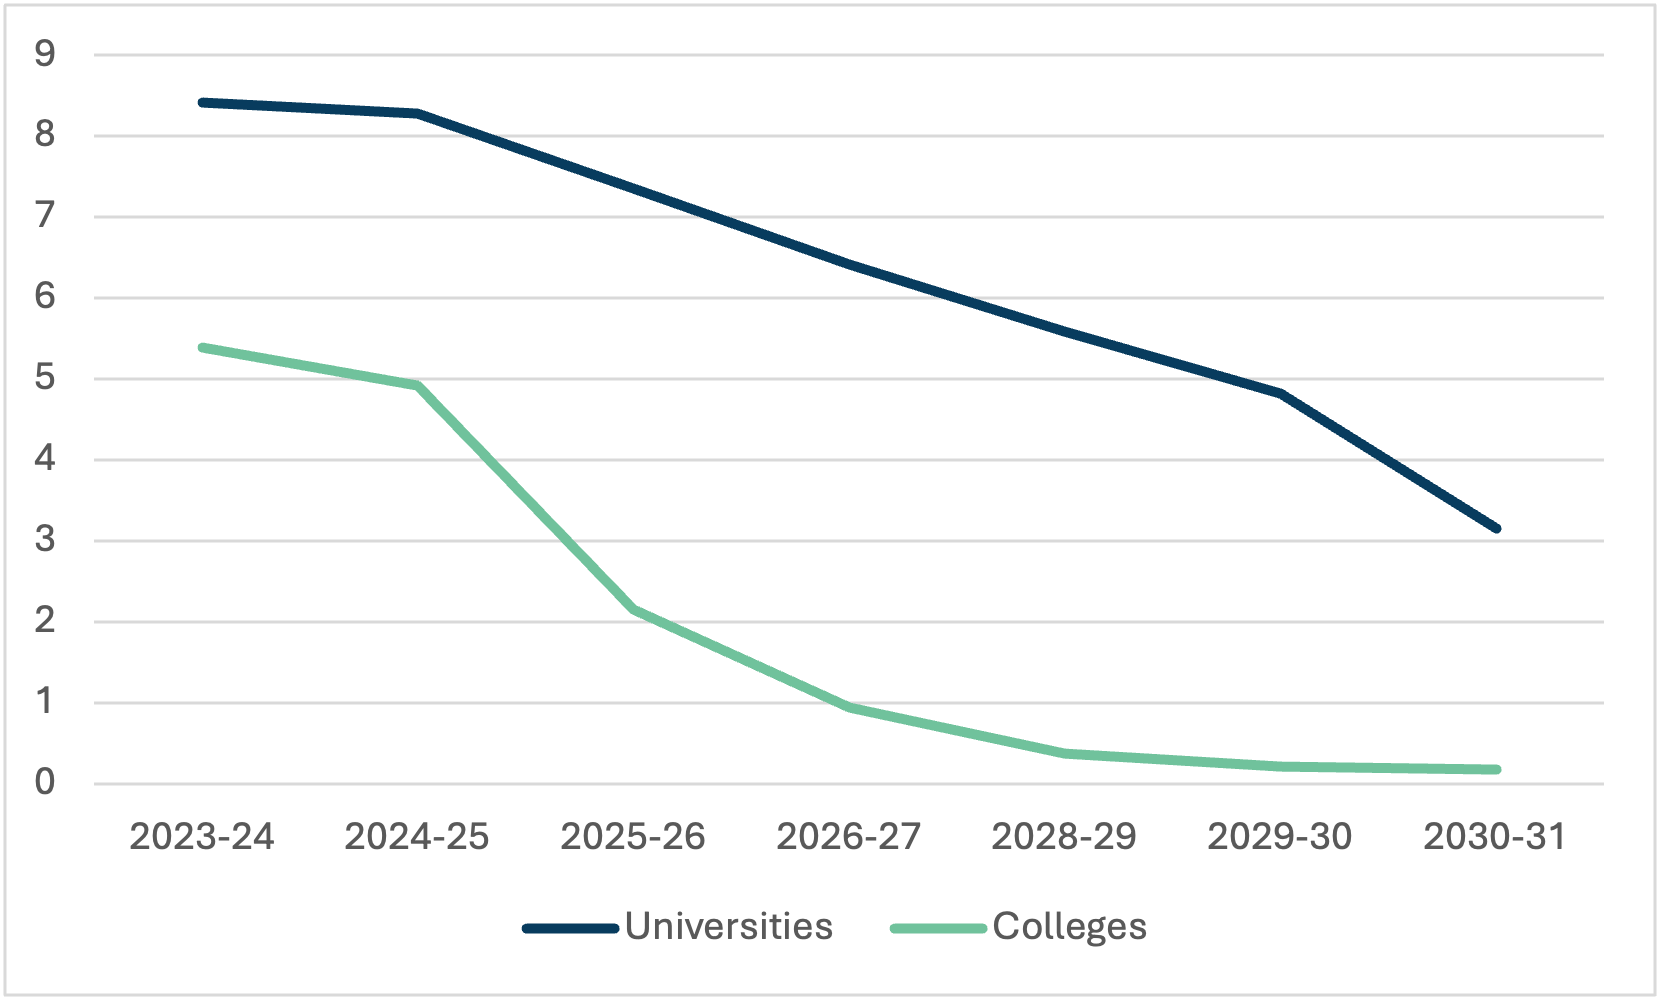
On the university side, however, because the decrease in international student fees is more protracted than in colleges (again because of differences in how long it takes for a cohort to cycle through), universities have so far only lost about $1 billion in international student fees. However, it will continue to lose that much again each year all the way out to 2030-31. The adjustments we have seen in the past eighteen months may therefore be repeated more than once in the coming years: in total, the remaining adjustment in universities amounts to about 11% of total current income.
The future is, of course, unlikely to unfold exactly as Figure 7 suggests. At some point, visa numbers will presumably rise again and put a floor under these numbers. But considerable damage will have been done, and there is little hope that increases in public funding will be able to erase what has happened here. That would require provincial spending to increase by about $6 billion, or about 30%, over the next five years. While some increase is possible – Ontario, for instance, has already announced an increase of $1 billion for next year – an increase of this magnitude seems unlikely given an aging population, competing political priorities and, particularly in Québec and British Columbia, some deeply unbalanced budgets.
In other words, while there is light at the end of the tunnel, it’s still some distance away. This saga still has a ways to go.
Anyways, hope you enjoy the almanac, and as ever – if you think of any topics that should be added to next year’s The State of Post-Secondary Education in Canada, just drop me a line.