




Hi all. Every couple of years I spend some time going through data on Chinese higher education and, in particular, the finances of the country’s top universities. It’s been two years since the last time I did this, so here goes:
Figure 1 shows total expenditures at what I call China’s Big 8 universities (which is actually just the elite C9 League of universities minus the Harbin Institute of Technology, which does not make previous years’ financial data available), in billions of 2026 RMB (n.b. the data for 2025 and 2026 are based on budgetary estimates rather than financial statements). There is not a lot to talk about here: everything is on an upwards trajectory, and Peking University is continuing to fall behind the much more STEM-focused Tsinghua, Shanghai Jiao Tong and Zhejiang Universities.
Figure 1: Total Expenditures at China’s Big 8 Universities, 2014-26, in Billions of 2024 RMD
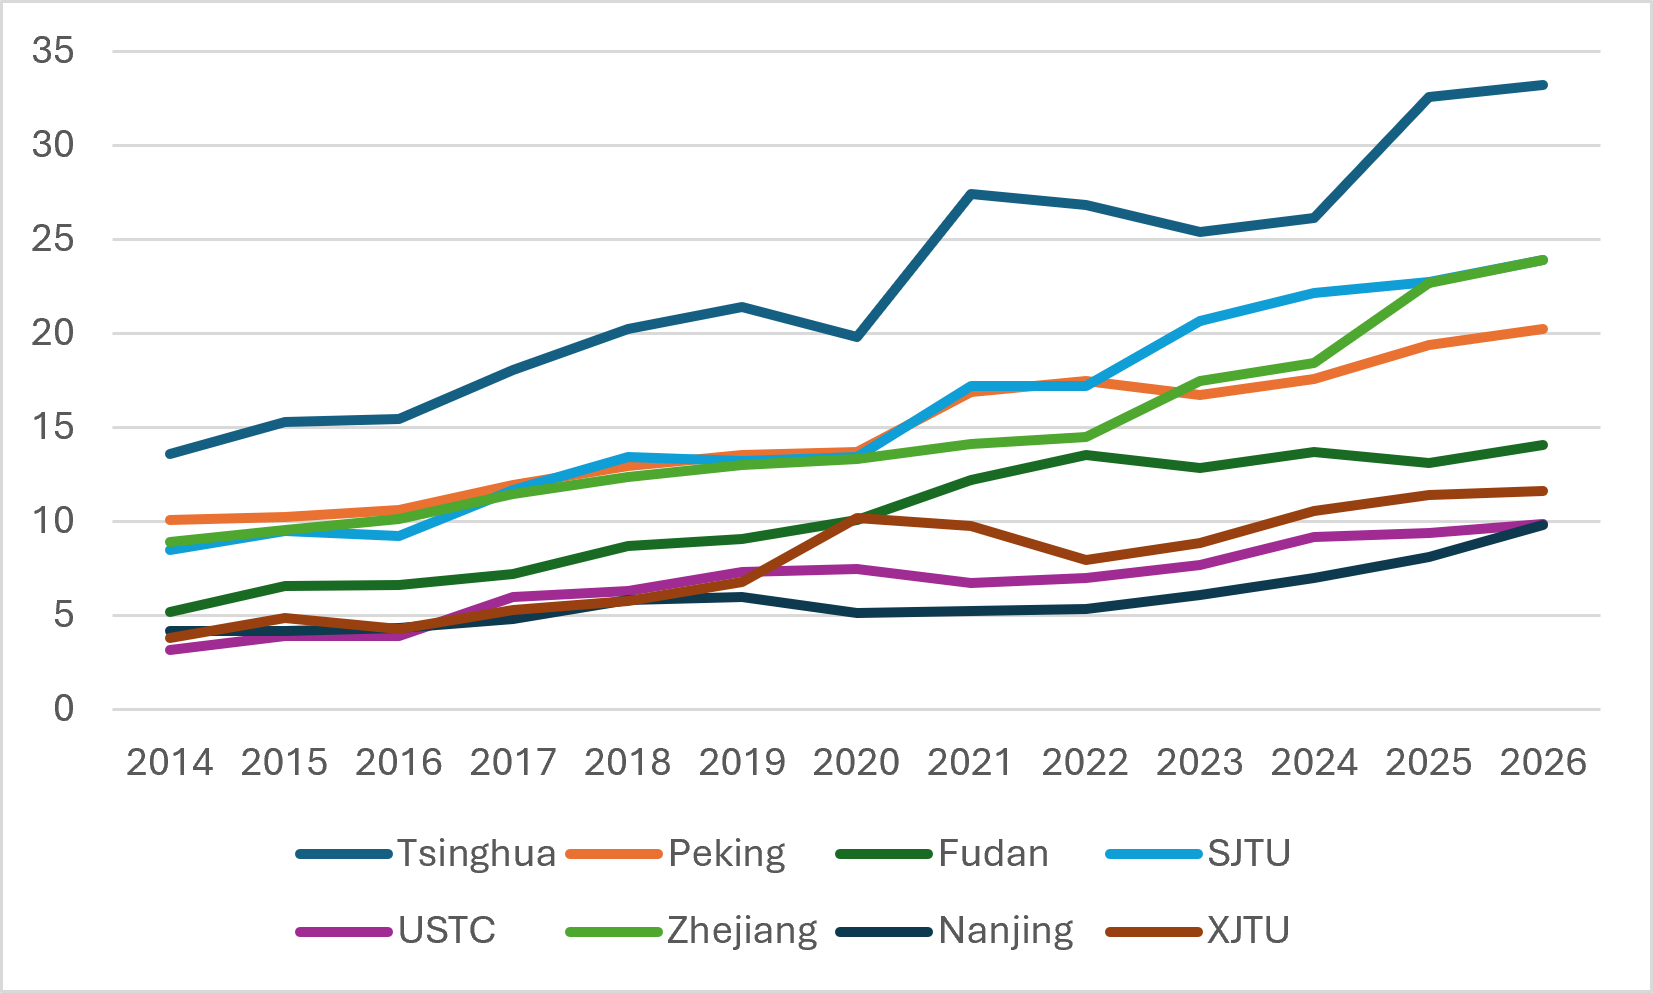
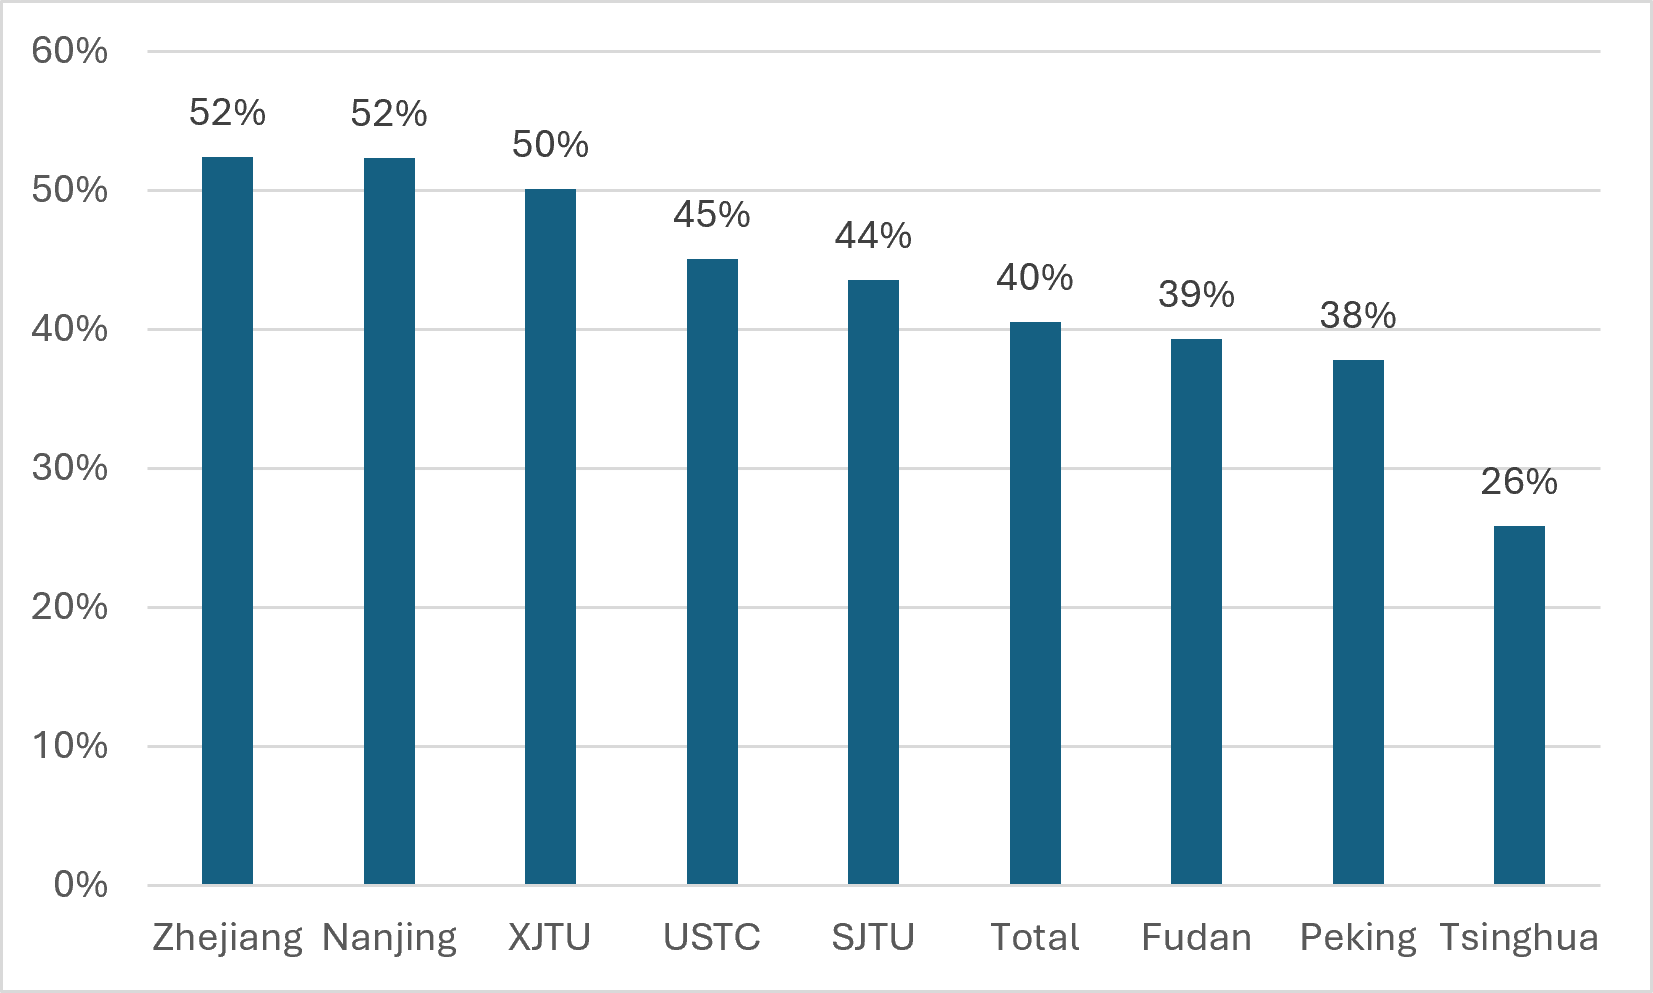
Figure 2 looks at how these same institutions are budgeting in 2026 compared to what they actually spent in 2020, adjusted for inflation. What you can see is that across the big 8, planned expenditures are up a hefty 40% in real terms over just 6 years, and significantly more than that at some institutions.
Figure 2: Real Change in Total Expenditures at China’s Big 8 Universities, 2020-26, in Billions of 2026 RMD
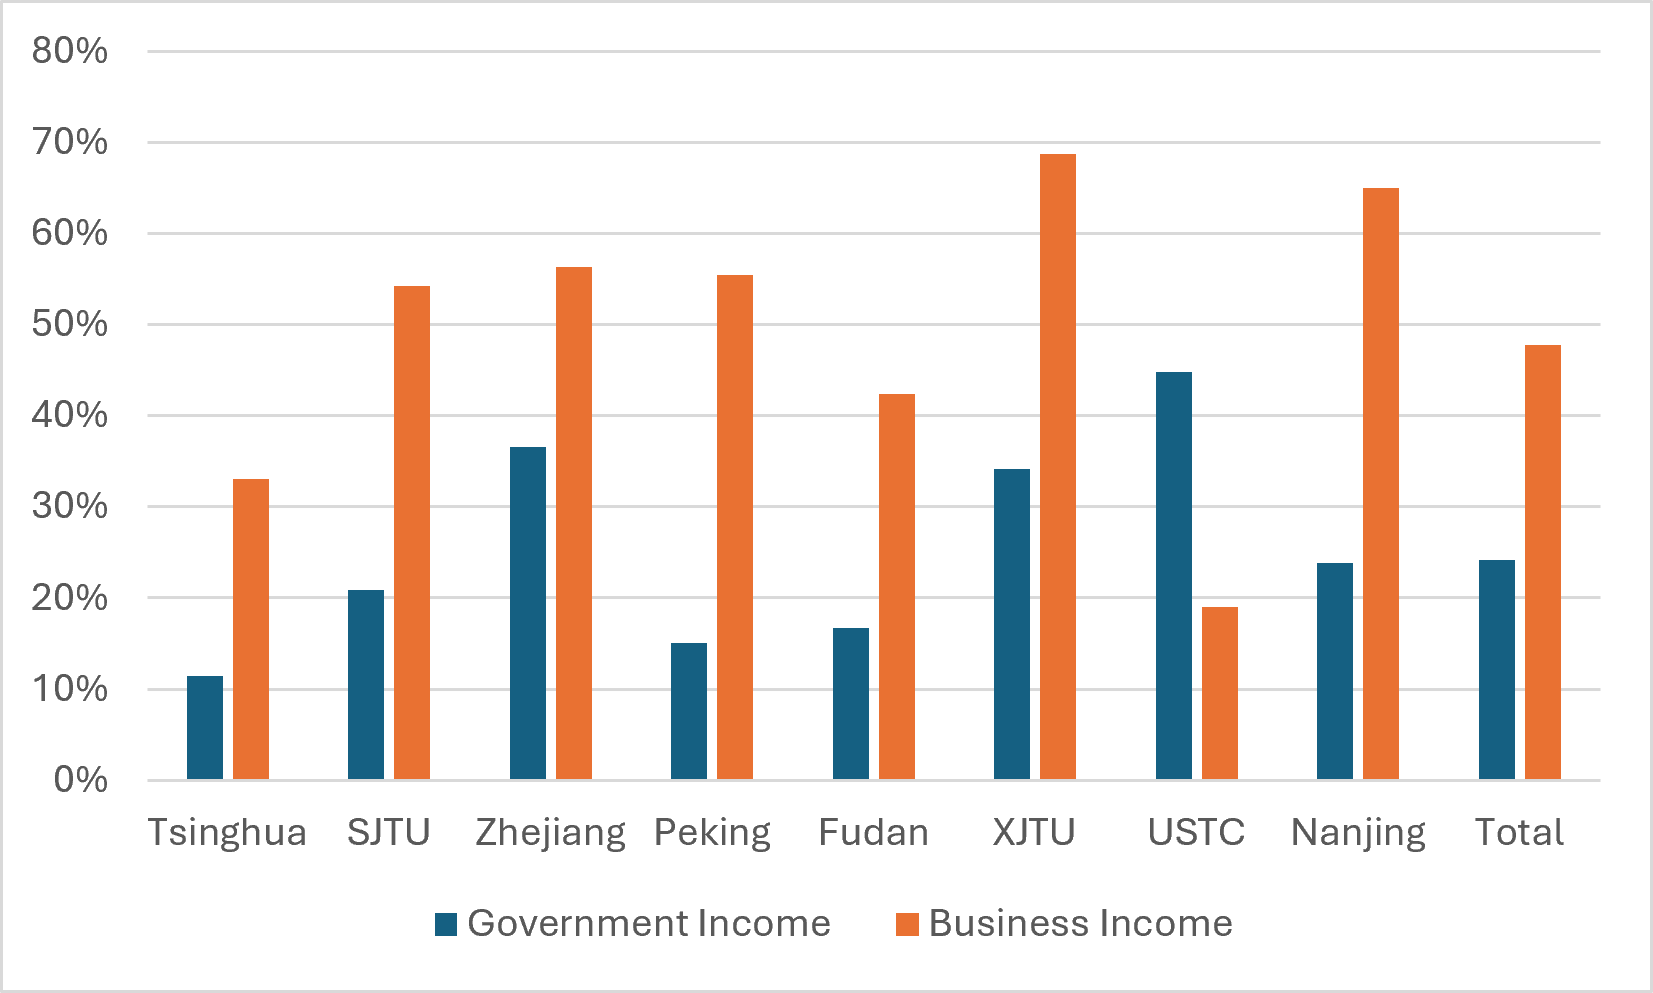
Those are certainly big numbers. But take a look at what happens when you just split out the budgeted government spending: it turns out that these big increases in income are mostly coming from institutional self-generated or “business” income. In fact, if we restricted the analysis just to the years 2024 to 2026 we would see government income actually falling slightly.
Figure 3: Real Percentage Change in Revenues from Government and Business Income at China’s Big 8 Universities, 2020-26
(Note, though, that Chinese universities define “business income” a bit the way German ones do with their concept of “dritmittel”: government income from competitive research grants do not get classified as government income but as business income precisely because it is “won” rather than “given”, but unfortunately public accounts don’t split out different types of business income very clearly).
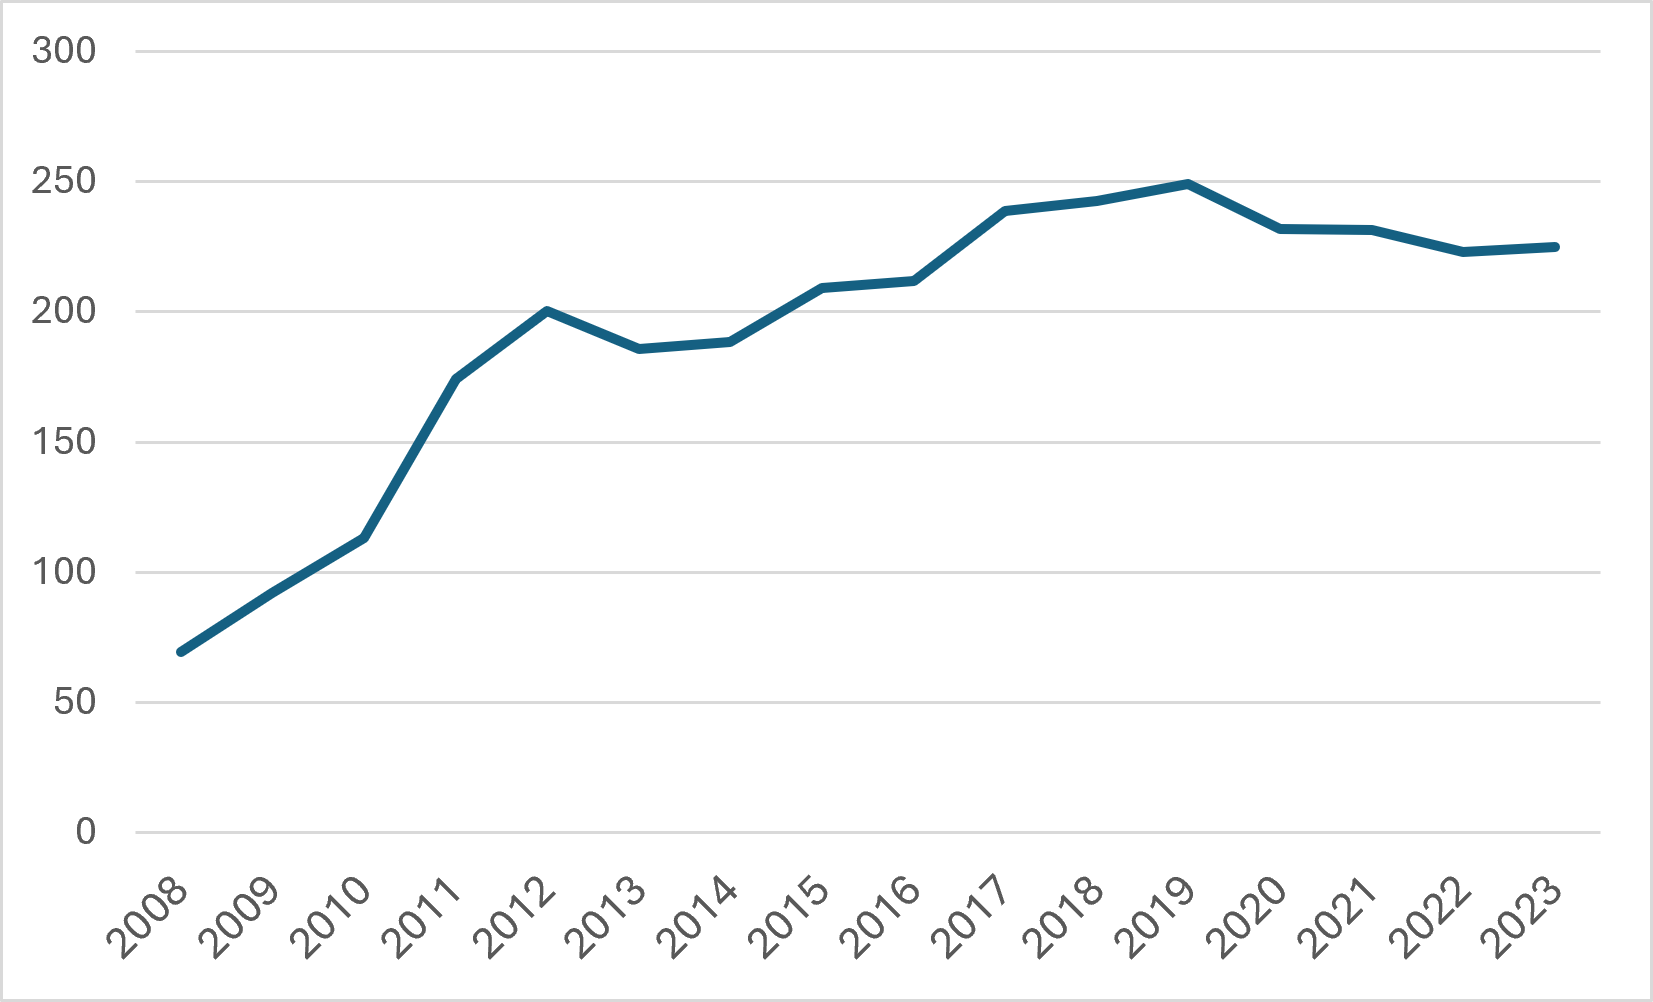
And, in fact, what big research-intensive universities are getting from government is considerably better than what the rest of the system as a whole is receiving. As figure 4 shows, in real terms higher education spending as a whole was slightly lower in 2023 than it was in 2017. (I’d have added 2024 data to this chart because it should be out now, but it seems as though the People’s Republic has decided to stop publishing data on higher education finance, preferring instead to lump it in an undifferentiated mass with K-12 funding, which is deeply unhelpful). In other words, looking at the top 8 institutions, who collectively receive about 15% of total public funding in China, might be giving an unduly rosy picture of what’s happening in terms of government support.
Figure 4: Total Public Funding to Higher Education Institutions, in billions of 2024 RMB, 2008-2023
In fact, if you look at the income streams of the Big 8 universities, as shown below in Figure 5, you can see that in fact the big Chinese universities now receive only about 25% of their income as a base budget from the state. Only at the University of Science and Technology of China does income from government top 40% of total income; and at the two wealthiest institutions it is under 20%. In many ways, this makes top Chinese universities resemble American ones in terms of their reliance on private sector income for their survival.
Figure 5: Composition of Income at China’s Big 8 Universities, 2020-24, in Billions of 2024 RMD
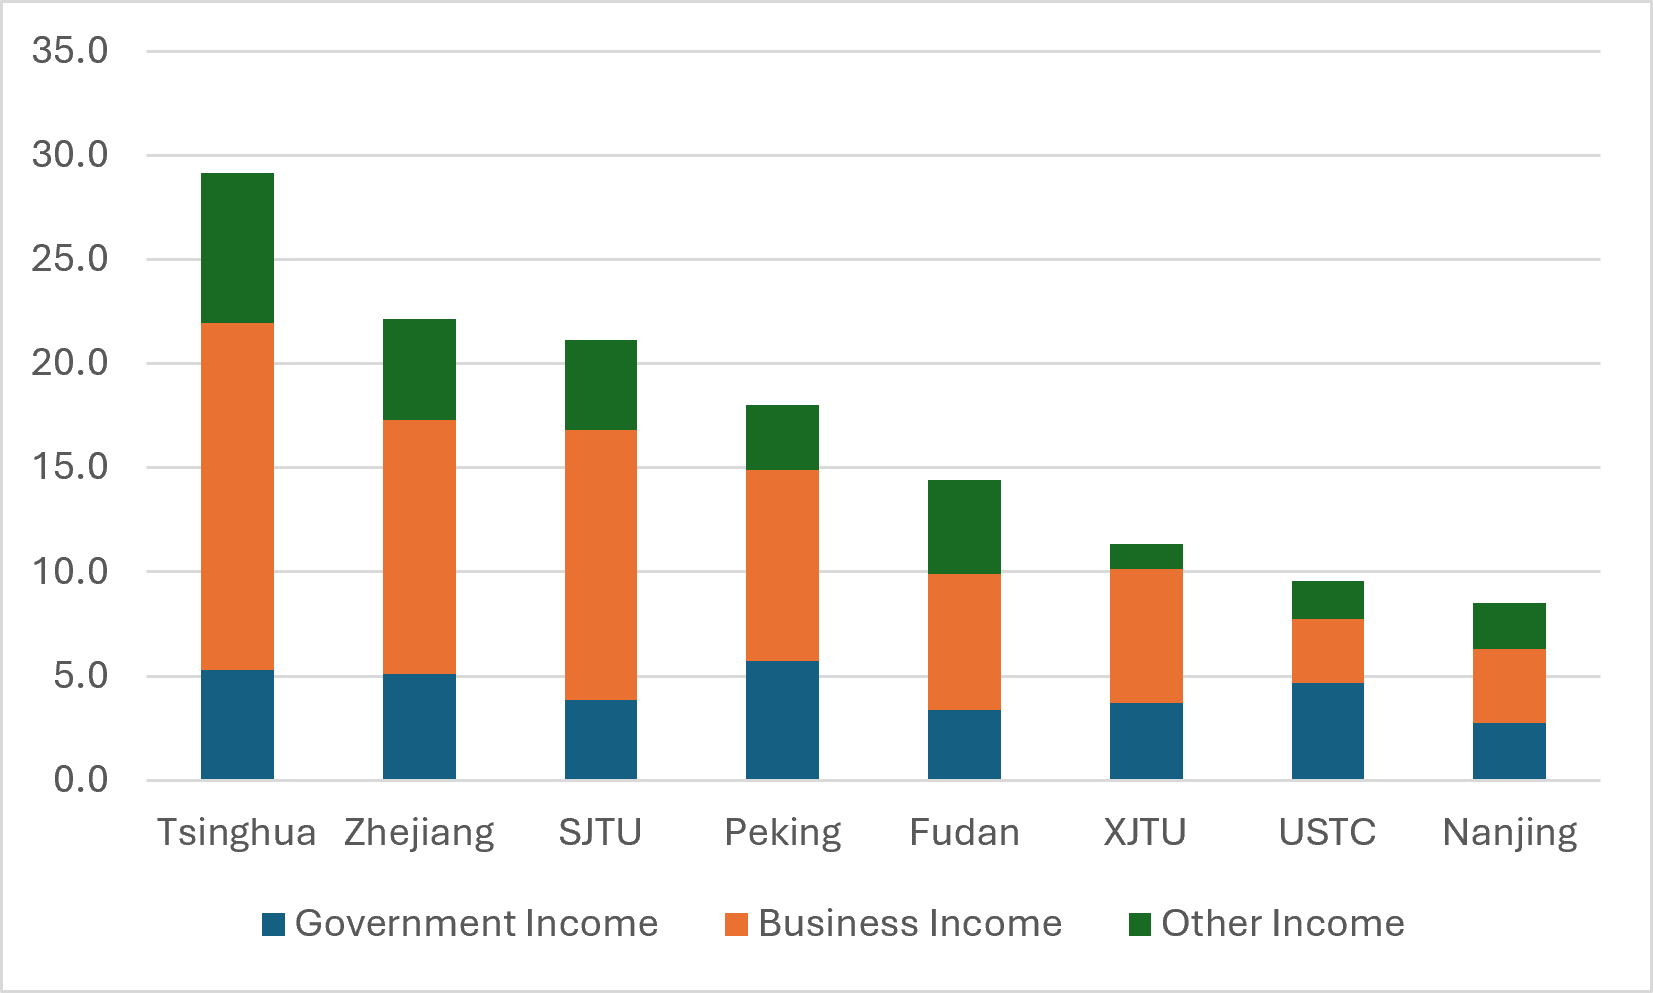
(I admit to not being entirely clear about the difference between “business” and “other” income is, other than that tuition and research are both under “business income” and philanthropic donations are counted under “other”. However, since this is the way Chinese universities arrange their accounts, it is the way I present the data, as well).
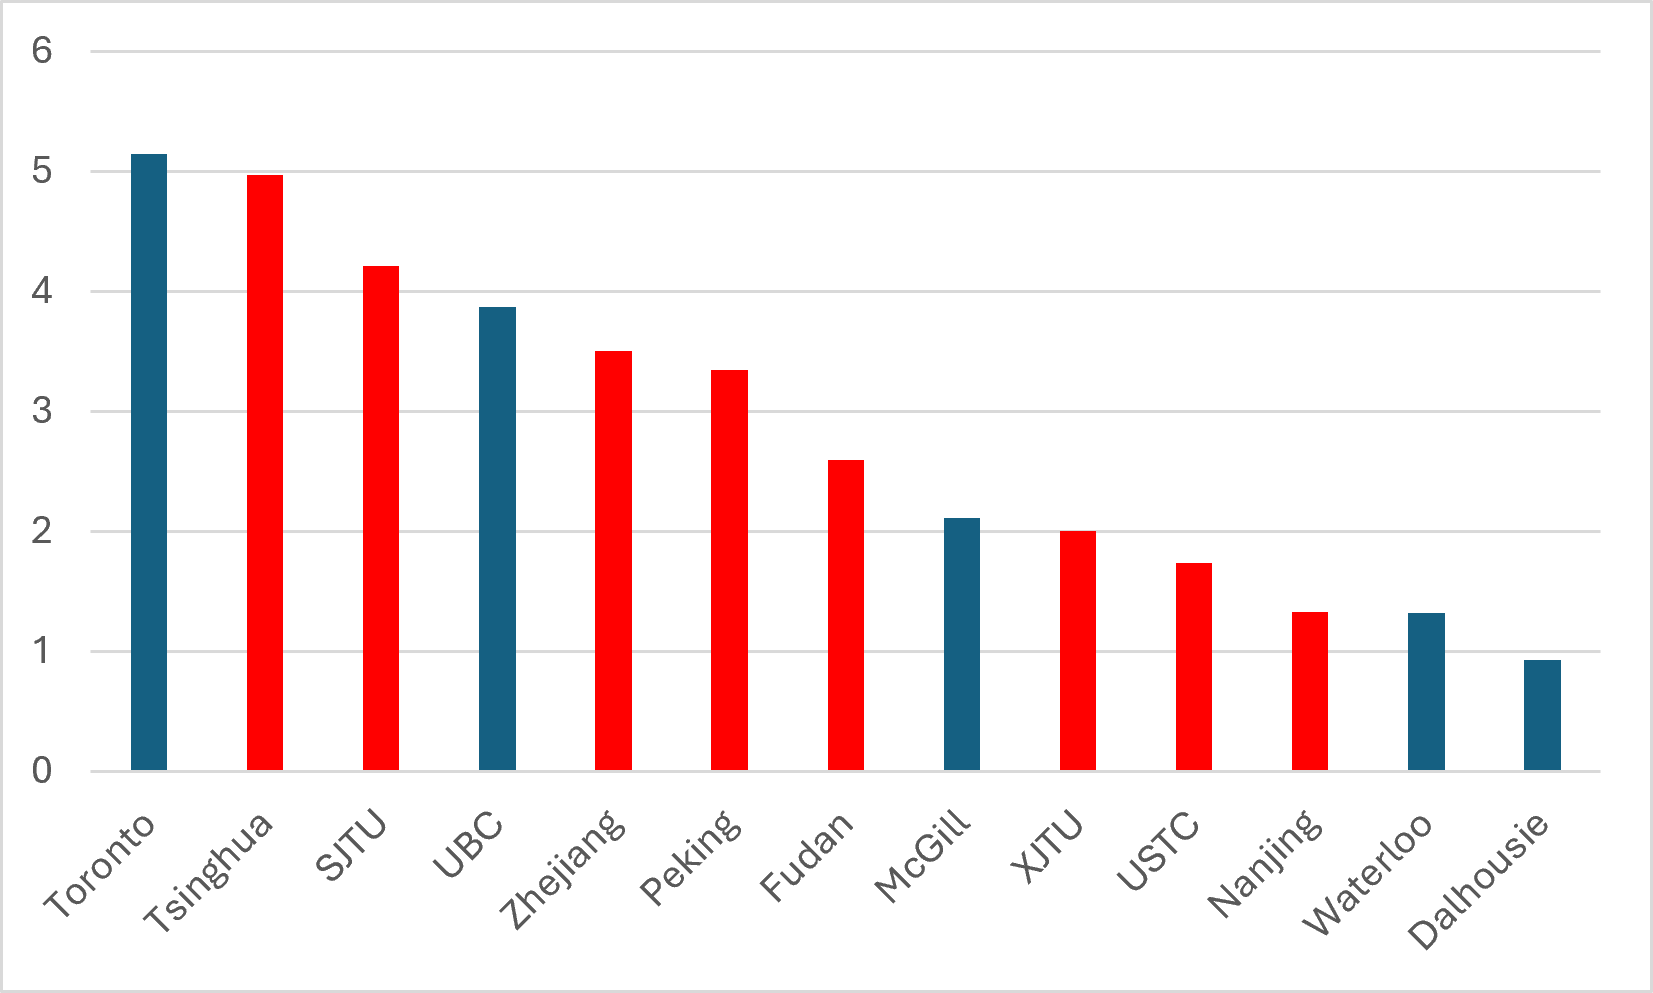
Finally: I have been showing all sorts of data in RMB here without giving y’all a sense of what it means in Canadian dollars. In figure 6, I show how these top Chinese universities compare to some Canadian ones, if you convert RMB to CAD at the current exchange rate (a shade under 5-to-1) for the fiscal year 2024. Toronto looks a lot like Tsinghua in terms of size, and UBC is comparable to Peking, Shanghai Jiao Tong and Zhejiang. Waterloo, which is kind of a median U-15 school financially, trails all of the Big 8. Note that if we used Purchasing Power Parity as a way to compare finances rather than exchange rates, the Chinese universities would look about 70% larger, which is a pretty significant difference.
Figure 6: Total Expenditures at China’s Big-8 Universities (2024) vs Select Canadian Universities (2023-24) in Billions of Canadian Dollars at Current Exchange Rates
You now know as much about Chinese educational finance as I do. We’ll do this again in 2028.