In yesterday’s post, I dismissed the idea that administration was to blame for academic salary mass falling as a percentage of operating budgets, noting that the big areas of spending increase over the last two decades were scholarships, benefits, and utilities. But it is still true that salary mass of non-academics rose more quickly than it did for academics. Total academic salary mass went from $4 billion in 1992, to $5.5 billion in 2010, while “administrative” salaries went from $3 billion to $5 billion (all figures in 2011 constant dollars). So in a sense, one could argue that some crowding out occurred.
But who are all these administrators? Are there more of them, or are they just getting paid better than they used to?
Unfortunately, we have no datasets on non-academic staff numbers in Canada (heck, thanks to budget cuts, as of last year we have no datasets on academic staff numbers either). What we can do, though, is track dollars by category to get a sense of what kinds of functions are receiving non-academic salary dollars.
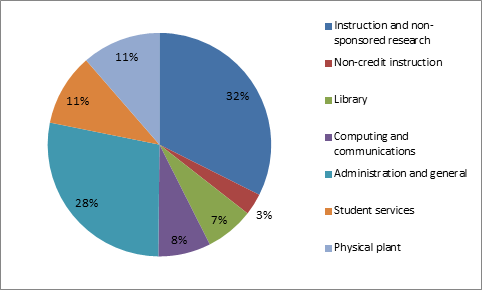
Figure 1 – Distribution of Non-Academic Salaries by Function, 2011
Of the $5 billion in non-academic salaries, the largest chunk (32%) is still spent under the rubric of instruction (e.g. lab technicians, departmental secretaries, teaching and learning centres, etc.). Student services and physical plant (i.e. maintenance) employees make up another 11% each, or about $550 million apiece, per year. IT workers are another 8%, library 7%, and non-credit instruction 3%. Most of those salary categories are things that are relatively central to the process of education. That leaves 28% – or about $1.3 billion – in what we think of as “classic” central administrators, the bogeymen/women of contemporary universities.
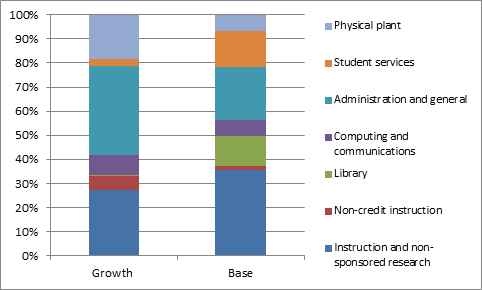
If we wanted to find “waste” in universities, we might look for it by looking at where non-academic salaries were growing the fastest. This we do in Figure 2, below. The left-hand column shows the share of the increase in non-academic salaries that each category received over the 1992-2010 period; the right-hand column shows the shares of spending each area had in 1992.
Figure 2 – Distribution of Increases in Non-Academic Salaries, by Function, 1992-2011
Figure 2 reinforces some traditional narratives; salary mass in central admin did indeed increase faster than for other non-academics. But so too did salary mass in non-credit instruction, and in physical plant. Total salaries in “instructional” areas (lab techs, etc.) fell relative to the total, but so too – and to a much greater extent – did salaries in student services. Total non-academic salaries in libraries, meanwhile, literally did not increase at all.
Bottom line: There was “excess” growth in central admin salaries – that is, growth over-and-above its inflation-adjusted 1992 share, to the tune of $325 million. Not nothing, to be sure, but a very long way from explaining the shortfall in academic salary mass.


 Tweet this post

Alex,
I think that the data you present may underestimate the administrative bloat at Canadian universities.
First, I believe that senior administrators at universities have two salary lines in the budget: one for their admin duties and another for their faculty duties. Administrators are hired with tenure and an academic salary along with an admin stipend/salary. They can (although most seem not to) go back to the faculty ranks an collect their faculty salaries. Often the faculty salary is largely inflated. To the entent that the faculty salary is included in the faculty salary line item, and the admin stipend in the administration line item, this would overinflate faculty salaries while underestsimation admin salaries.
Second, if one were to broaden the definition of administration to include a number of activities that you have listed above (e.g., student services) this might provide a clearer picture. Some of the administrative bloat that we have seen is the result of greatly expanded non-academic units on campus, often because the swelling of senior administrator ranks results in the increase in the number of admin-related support staff.
I suppose one could also argue that their may be some creative accounting going on at some institutions.
If we only had better numbers to look at.
Just want to check, Alex: are you sure that your data set classifies the salaries of academics holding administrative office (presidents to deans, say) consistently across institutions? As you know, in some universities these personnel remain part of the academic staff bargaining unit. Are their compensation packages in “academic” or “administrative” expenditures in this data?
I don’t know the answer to this, but I can’t imagine it would make a lot of difference. It would increase the size of the central admin pie, but it likely wouldn’t change its rate of increase.
Excellent series, thank you.
But I think Rick Mueller is correct. Caubo numbers cannot capture administrative bloat.
Here is the definition of Academic ranks (from page 14 of the 2011 reporting Guidelines) :
Academic ranks: “The academic ranks include deans, professors, associate professors, assistant professors and lecturers.
Academic salaries also include payments to staff members in the academic ranks for various types, of leave such as administrative, academic or sabbatical”
In short, this definition leaves much room to fudge. An associate vice-rector is (at least in my university) on academic leave and teaches no courses. That person’s salary can thus be counted in the “academic ranks” category. Same thing for the growing number of vice-deans.
And notice that even Deans are counted in “academic ranks.”
CAUBO data are extraordinarily useful, perhaps the only data set we have that allows us to analyze trends over time and to compare universities (the survey’s main goal being to provide data that is “consistent from one year to the next, and comparable between institutions.” [again, from the reporting Guidelines] But on this one question – is there or is there not administrative bloat – it is alas of little help, IMHO.
That’s helpful, thanks.
Well, in 1996, the Dean’s office had the Dean and one admin assistant, for a total of two people. In 2013, the Dean’s office has 15 people, including Associate Deans, Assistant Deans, a public-relations person, fund-raiser, sustainability officer, and various other non-academic type administrators. All of the jobs pay over 100k per year. Enrollment has gone up a bit, but not 7-fold. I think this constitutes serious administrative bloat, but maybe I am mistaken.
Sounds like a good case to me (though the various assistant Deans are probably not a big draw on funds since they;re still profs). What would be a good way of tracing position growth backwards in Deans offices? Seems like an interesting way to attack the problem from a research perspective.