Yesterday, we saw that Canadian student-faculty ratios rose by 24% between 1992 and 2010, even though operating grants per student went up by 20%. The cause, it turned out, was a combination of individual academic salaries rising, while aggregate academic wages fell, as a proportion of operating grants. What we didn’t do yesterday was ponder why academic salary mass didn’t keep up with operating grants, and where the money went as a result.
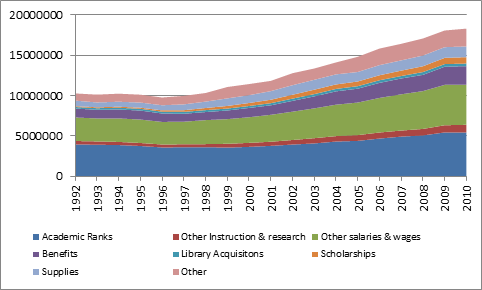
Figure 1 – Operating Expenditures by Category, 1992-2010, in Real 2011 Dollars
Figure 1 shows that the two biggest categories under operating expenditures are “academic salaries”, and “other salaries and wages”. Throw in benefits – compensation under another name – and these three categories make up about two-thirds of total operating expenditures.
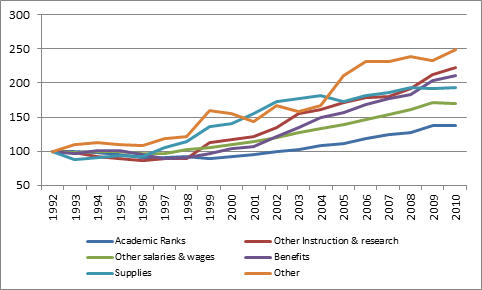
With so many categories, it’s a little difficult to see exactly how much each category increased over time in Figure 1, so in Figure 2 we simply show growth indexed to 1992 levels.
Figure 2 – Growth in Expenditure Categories, 1992=100
Of the six major expenditure categories, academic salaries increased the least, by some margin – just 37% in real dollars, not quite enough to keep up with growth in student numbers. Non-academic salaries – the next largest category – increased by 70%. But growth for benefits, “other instruction & research”, and “other” (a catch-all category including travel, utilities, and externally contracted services) was all over 100%.
For reasons of legibility, Figure 2 excludes two line items that were in Figure 1. The first is library expenditures, which are actually pretty trivial in the big picture (1.7% of operating expenditures). The other is scholarships, which are excluded because they would have broken the scale. Here’s what happened to scholarships between 1992 and 2010:
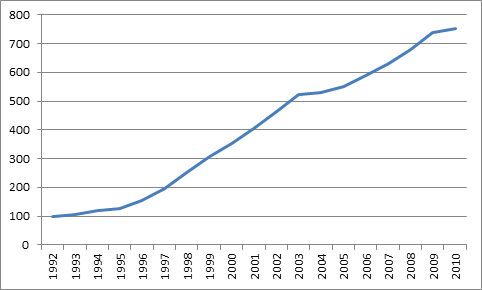
Figure 3 – Total Scholarships Expenditures, 1992-2010, in 2011 Dollars
This is one of those things universities just don’t get credit for. Scholarships (a term which here includes both need and merit-based aid) increased by more than seven-fold, after inflation. Based on previous research HESA has conducted, I estimate that between 55 and 60% of this money went to graduate students, which is consistent with large institutions’ increasing emphasis on research and graduate studies.
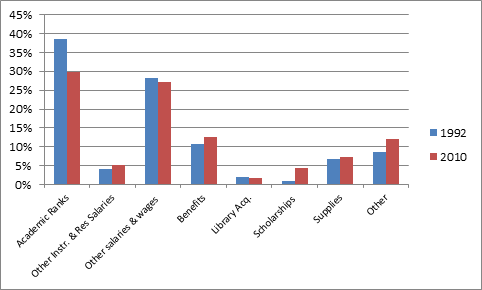
Another way to look at this question is to look simply at changing shares of total operating income, which we do below in Figure 4.
Figure 4 – Change in Shares of Operating Budgets by Category, 1992-2010
Although spending in all categories rose between 1990-2012, some spending categories “gained share”, while others lost it. The biggest losers were faculty, as academic salary mass fell by 9 percentage points as a share of the operating budget. Had they kept their share constant, there would have been another $1.6 billion in money for academic salaries.
But the “culprits” were not the oft-scapegoated bogeymen of “administration”. Rather, the line items that significantly gained share were actually scholarships, non-wage benefits, and “other” (mainly utilities and externally contracted services). This is not a story often heard on campus. But it’s the truth.


 Tweet this post

Alex,
Just a comment regarding academic salary trends from operating funds. Over the period observed did you see an offset of academic salaries paid from funds other than operating? I’m curious whether the absence of CRCs (restricted funds) and endowment funds contributes to the observed share decrease of operating funds directed towards academic salaries?
It would be very interesting to see how the growth in scholarship expenditure compares to tuition growth and/or the growth in enrolment. Perhaps a topic for a future edition of “One thought to start your day”?
Much appreciation for the dialogue.
Don
Hi Don. Thanks for writing. That’s a good question about salary funds from outside operating. I don;t think so, but I will re-check. That said, I;m not sure how CRCs would be accounted for.
Scholarship expenditure vastly outstrips tuition growth and enrolment growth combined.
Alex, this series of posts is very interesting. Thank you for giving your source for the tables in a comment to a previous post. Would this data be consistent with the idea that universities are replacing tenured or tenure-track faculty with sessional instructors? I would also be very interested to see what is in that “other” category besides utilities (educational software? Marketing consultants?)
From inside a university, changes in how money is distributed to different fields and sub-fields are significant. For example, one hears that journal fees in medicine, engineering, and science are consuming a higher proportion of library budgets, putting pressure on other fields.
Hi Sean. Thanks for reading.
I don’t think it’s accurate to say universities are “replacing” tenured staff with sessionals, as TT staff #s are well up. I think it is more accurate to say the are an increasing component of new growth.
Re: other. I believe the way we have constructed this category, both of those things are in there. To the extent that we could parse anything out, utilities were the fastest growing (and largest) sub-component.