Good morning. Yesterday, I examined recent trends in income at Canadian universities; today I want to take a look at what is happening on the expenditures side.
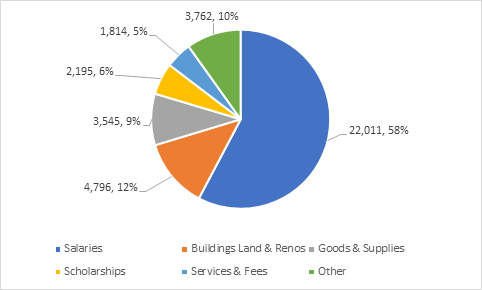
Let’s start by looking at expenditures by type. Universities are labour-intensive places, with 58% of total expenditures devoted to labour of one sort or another (if we were to look just at operating expenditures, it would be higher). About 12% goes into new buildings, building renovations, utilities and general upkeep. Nine percent is devoted to various categories of expenditure, which can be summarized as “buying stuff” (materials, supplies, equipment, furniture, library acquisitions, etc.), six percent goes to scholarships, five to various types of professional fees and contracted services, and ten percent to everything else.
Figure 1: University Expenditures by type, in $ Millions and % of total, 2017-18
To look at change over time, Figure 2 looks at major expenditure categories and their absolute change over one and five years. The big news here, obviously, is that there was a pretty big jump in spending on buildings & renovations in 2017-18, which I am fairly sure we can attribute to that whack of federal money known as the Strategic Infrastructure Fund (SIF). If you have a particularly sharp eye and memory, you may be saying to yourself – wait a minute, SIF? You mean, that big whack of cash spent by the Trudeau government in 2016 on “shovel-ready” projects to fight an almost-recession that ended in the second quarter of 2015? Yup, that one. Apparently, all that alleged counter-cyclical spending ended up getting disbursed in 2017, which in terms of GDP growth was the best since 2011, and certainly the top of this economic cycle. Go figure.
Figure 2: Growth in Expenditures by Type, Selected Types, Canadian Universities, 2017-18
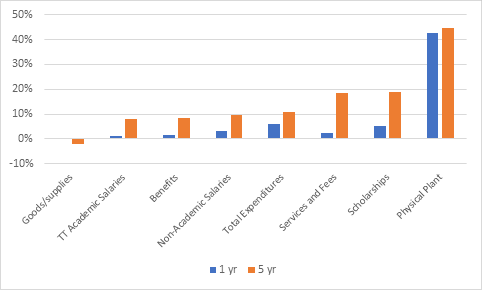
If we look at a longer five-year perspective, and ignore the physical plant result, which is really a one-year phenomenon, what we see is this: Two specific areas of institutional spending are consistently growing at above-average levels: professional fees and external services, and scholarships. And one area (two if you ignore the one-year bump in physical plant) is going down slightly – the purchase of various physical goods, supplies and equipment. Aggregate salaries for tenure-track academic salaries are growing slightly slower (7.9% over five years) than aggregate expenditures; salaries for non-academics are growing slightly faster at 10% over five years.
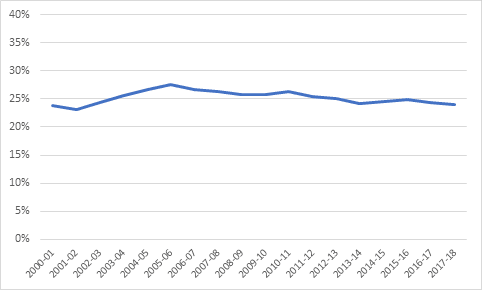
One interesting fact from the 2017-18 data is that spending on academic salaries to individuals without academic rank – that is, sessionals – actually fell from the year before. I know there’s the steady drumbeat of talk on campuses that universities are constantly replacing full-time faculty with sessionals, and I suppose it’s easy to spread that kind of talk with no data speaking directly to this point one way or the other, but the expenditure evidence seems to point the other way. In fact, as Figure 3 shows, the percentage of total academic wages going to sessionals hit a 15-year low in 2017-18.
Figure 3: Percentage of Total Academic Wage Expenditures Given to Non-Tenure Track Staff, Canada, 2000-01 to 2017-18
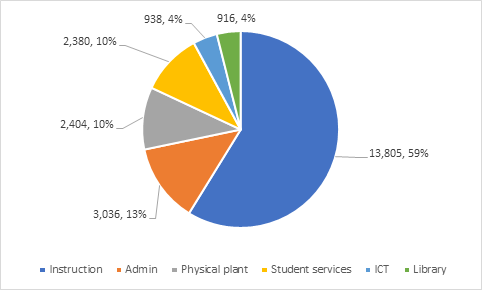
Turning to the division of operating funds by function, we find that “instructional” expenditures make up 59% of total operating spending at universities (at a high level of approximation, the definition of “instructional” spending means any spending you can apportion to a specific academic Dean or academic faculty). The next big areas of expenditures are administration at 13% (if you include all of “external relations”, meaning community/government relations plus fundraisers, which now accounts for a non-trivial $564 million nationally). Student services and physical plant each account for roughly 10% of total spending, while ICT and Libraries each account for roughly 4%.
Figure 4: Operating Expenditures by Function, in $ Millions and % of total, Canadian Universities, 2017-18
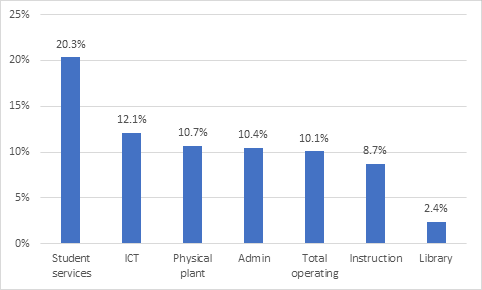
Now, what’s particularly interesting is where the growth is in all this spending. By some distance, the biggest spending increases over the past 5 years are in student services (21%, in inflation-adjusted dollars), followed by ICT. Spending on Administration and Physical Plant (which, because we are talking only about the operating budget, is purely maintenance, not construction) is up by between 10-11%, roughly the same as overall spending growth. Spending on “instruction” is up by a little less than 9% and spending growth on poor old libraries was just 2.4%.
Figure 5: Change in Real Expenditures by Function, Canadian Universities, 2012-13 to 2017-18
The key takeaway here is this. Despite all this “austerity” people keep yammering on about, operating expenditures are rising pretty steadily at about inflation plus 2% which is not “austerity” for anyone in the real world. And despite many complaints about university salaries being out of control, in fact they aren’t rising any faster than the rest of university expenditures. That doesn’t mean neither is a problem: it may in fact mean both are a problem which need to be tackled simultaneously.
Food for thought for the academic year ahead.

 Tweet this post

This is truly amazing.. It is not easy to track and survey all the expenditure data of Canadian university expenditure. You did a great job.
Second thing, I am wandering if the Percentage of Total Academic Wage Expenditures are almost same from 2001 to 2018 even after the inflation. I agree that increasing operating expenditure and salary issues are both need to be focused on to deal rationally.
“the expenditure evidence seems to point the other way. In fact, as Figure 3 shows, the percentage of total academic wages going to sessionals hit a 15-year low in 2017-18.”
Could it not be the case that there are more sessionals AND they’re getting a smaller piece of the pie?