


So, the 2017-2018 Financial Information of Universities and Colleges survey dropped in July, and as usual I’ve got a two-parter, one on income and balances (today) and one on expenditures (tomorrow).
Figure 1 shows the big, long-term picture. University income, in real dollars, is still on an enormous long-term up-tick. This year, total income was $38.7 billion, down very slightly this year from last because it wasn’t quite as bumper a year on the investment/endowment front.
Figure 1: University Income by Source, Canada, 1979-80 to 2017-18, in constant $2017
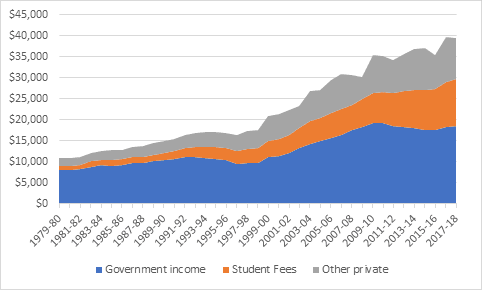
The big change over the past decade, as I’ve noted several times in the past, has been the flatlining of government support and the massive increase in income from student fees. Now, what’s interesting here is that the increase in student contributions hasn’t come about through huge increases in domestic tuition fees. Base tuition has been rising at about inflation +1.5%, but tuition income has been rising at inflation +5%, which has essentially made up for any loss of government income plus a little bit more. Figure 2 shows the rate of change, in real dollars, of income from these two sources over the last one, five and ten years.
Figure 2: Real Change in University Income from Governments and Students over 1-, 5- and 10-years, 2017-18
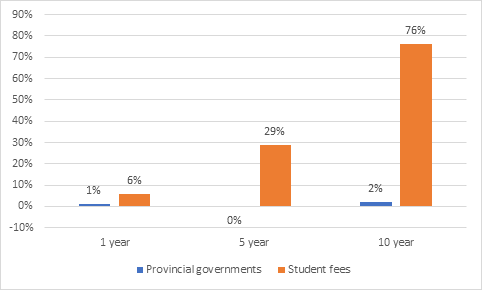
Kind of mind-blowing, huh?
But to look at overall financial health, I like to look at two different sets of numbers. The first is operating income (which, very roughly, is fees plus provincial government grants) vs. operating expenditure and the second is total income vs. total expenditures. Normally, you want these numbers to be in surplus. In Australia and the UK, universities shoot for 5-6% surpluses just to be on the safe side. In Canada, what we find is that operating budget surpluses are usually in a similar 5-6% range, but total surpluses are usually much smaller.
Figure 3: Net Operating and Net Total Surpluses, Canadian Universities, 2007-07 to 2017-18
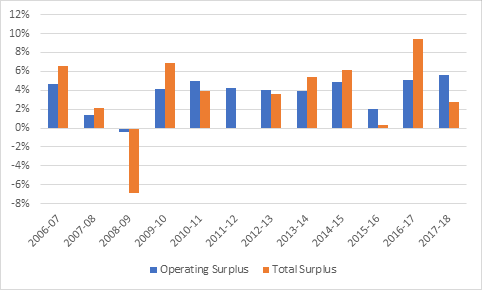
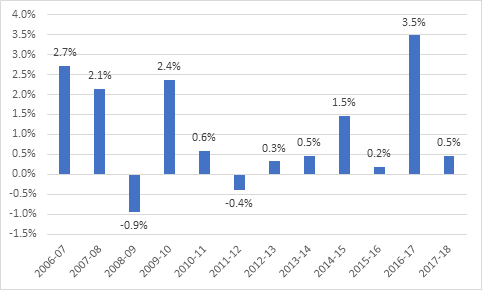
You’ll note in Figure 3 that the total operating surplus figure is much more volatile than the one for operating surpluses, and there is a pretty simple reason for that. Over the past ten years, investment income has made up between -7% and 7% of total income, depending on how equity markets are doing. So, it’s interesting to look at total institutional margins, stripping away endowment income (much of which can’t be used anyway because it’s meant to be re-invested) from the equation. And the picture is actually a little bit scary: if you exclude endowment income, for 6 of the last 8 years, Canadian universities as a whole have had a net surplus of less than one percent, which suggests that for the most part, there is not a lot of margin to work with (at least if you take the current cost framework as a given).
Figure 4: Total Surpluses Minus Endowment Income, Canadian Universities, 2006-07 to 2017-18
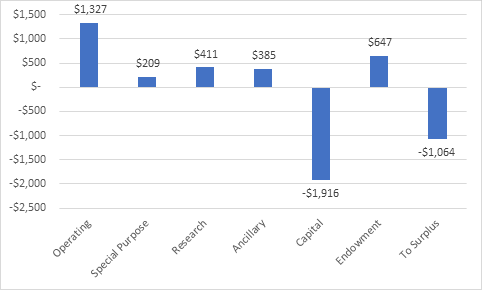
Another interesting way of looking at net revenues is to look at revenues vs expenditures by fund, as below in Figure 5. What we see is that universities have significant surpluses in the operating budget (1.3 billion), endowment revenue, research and ancillary enterprises. And nearly all of this then goes either to supplement the capital budget, on which they spend nearly $4 billion per year or into some kind of institutional surplus, some portion of which may end up in some kind of capital expenditure in a future year.
Figure 5: Net Surplus/Deficit by Fund, in Millions, Canadian Universities, 2017-18
In other words, it’s quite true that universities are doing very well in terms of income. But their expenditures are rising just as quickly, leaving them very little room for manoeuvre should income ever fall (as it clearly will this year in Ontario and next year in Alberta).
Tomorrow: more on expenditures.

