China has been home to the world’s largest higher education system for more than a decade now. Everyone is aware of China’s rise in research over the last two decades: Lord knows the Times Higher Education drowned us all in “Rise of Asia” (by which they really meant “rise of China”) stories for much of the 2010s. But have you noticed how little we’ve heard lately? And I don’t just mean during COVID – the chatter about China was declining even before anyone had heard of the Wuhan Huanan Seafood Wholesale Market.
So today, let’s take a quick look at what’s been happening over the past decade or so. Let’s start with total enrolments. Figure 1 shows the distribution of Chinese students by type of institution. Overall, enrolments rose by a little over 18 million between 2006 to 2018, from 27 million to 45 million students. A number of countries in the developing world grew faster than this over the same period, but no country other than India grew more in absolute terms. That’s pretty impressive.
Figure 1: Total Enrolments by Institution Type, People’s Republic of China, 2006-2018
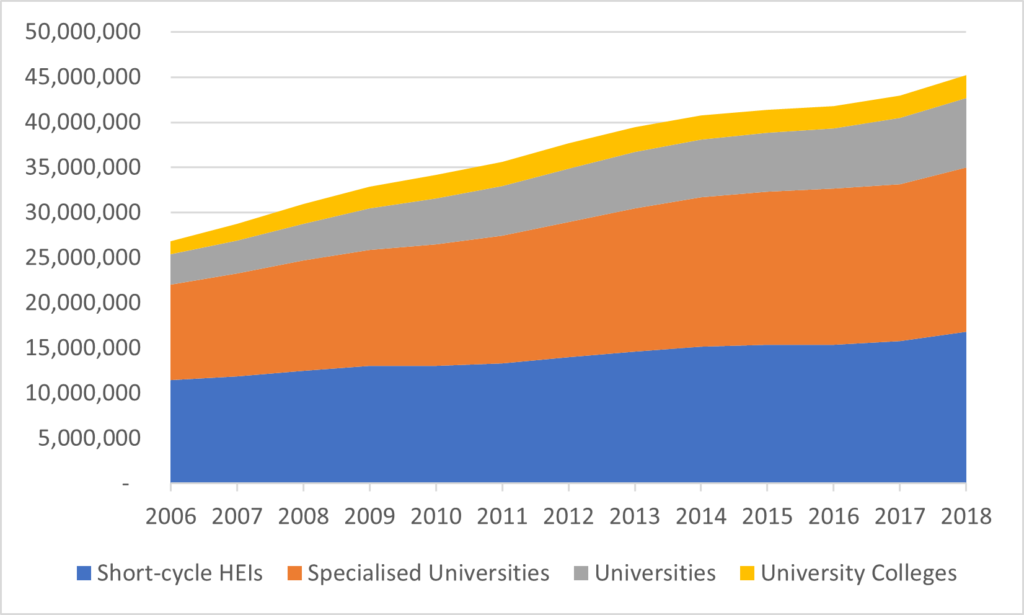
But look a little more closely at that figure and you’ll realise that the composition of these enrolments is a bit strange. China’s higher education system looks like almost no other in the world: it’s a weird mix of the old Soviet system (lots of specialized universities training people in narrow ranges of typically vocationally-oriented programs – police universities, communications universities, railway universities, etc.), and the North American system (tons of students in short-cycle institutions). In fact, among the 40 largest systems in the world, only Kazakhstan has a greater proportion of students in its short-cycle institutions and none have a smaller percentage in its big, comprehensive universities.
That’s not really the picture you get of China, is it? Usually, when you hear about Chinese education, you hear about powerful, strapping multi-versities like Tsinghua, Fudan, Zhejiang etc. But it turns out these institutions educate less than 18% of all higher education students in the country.
I’ll come back to the flagship universities in a second, but first let’s look at funding trends in higher education. Figure 2 shows total public expenditure on higher education in billions of constant 2018 US dollars from 2006 to 2018. There is a simply massive increase in expenditure between 2006 and 2013: in those seven years, increases in public expenditure equalled about 17% per year, a figure so vast that it permitted the system both to grow enormously while simultaneously doubling per-student expenditures.
Figure 2: Total Public Expenditures on Higher Education in Billions of 2018 USD, People’s Republic of China, 2006-2018
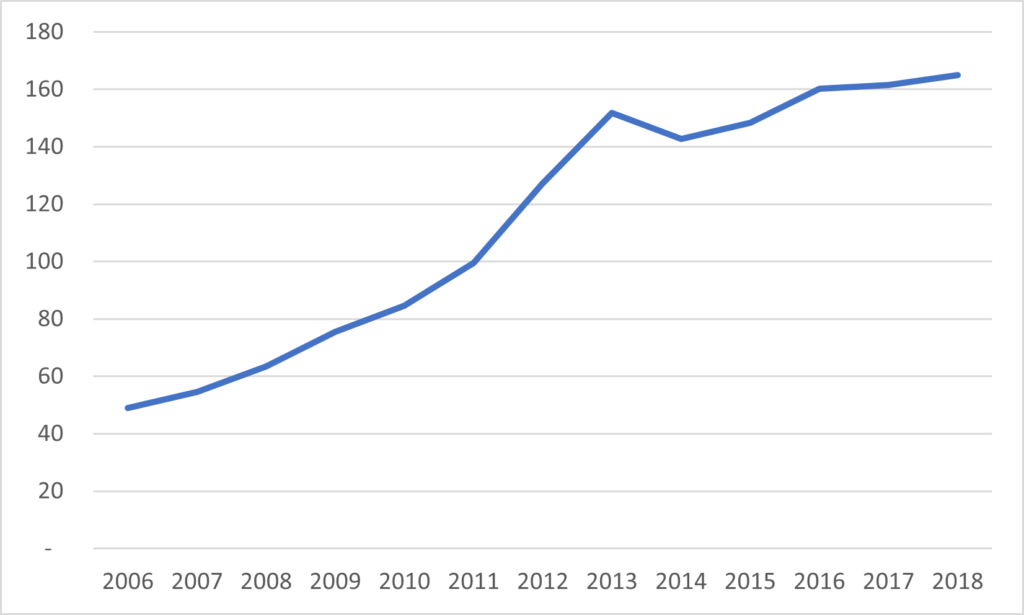
But then look at what happened in 2013, smack-dab in the middle of the Twelfth Five-year plan: public expenditures on higher education hit a brick wall. Since then, expenditures have increased by less than 2% per year, meaning that on a per-student basis, public funding in China is actually declining. What happened in 2013? Certainly, there were no public pronouncements about driving down higher education funding increases. But that was the year Xi Jinping came to power. Coincidence? Hard to say for sure, but it is an intriguing correlation at least.
Anyways, let’s go back to the flagship universities and their finances, something I did a few years ago but bears another look. Over time, Chinese universities have become pretty good at releasing their financials. I won’t say these financials reveal much about what’s going on inside institutions, because nearly all expenditures get lumped into such large categories as to be essentially meaningless, but they do give you a pretty good sense of broad trends in income and expenditure. Among the “top” universities in the C9 Group (their version of the U15), eight out of nine have consistent data available since 2013, the year the public funding chill set in.
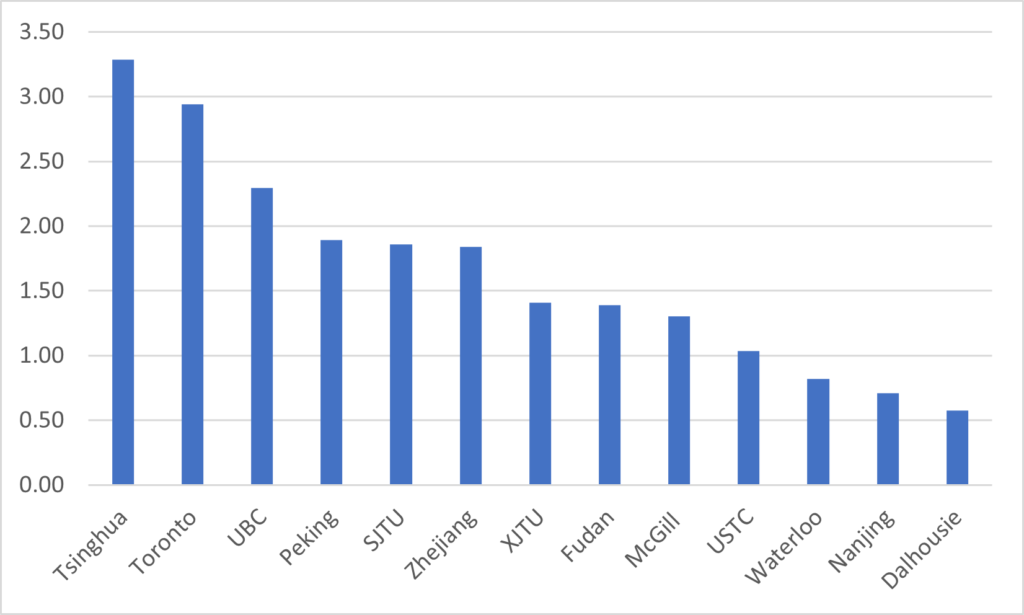
Figure 3 shows the expenditures in 2020 for each of the C9 institutions for which data are available along with a couple of Canadian institutions for comparison. With the exception of Tsinghua University, none of the Chinese universities really look like world-beaters financially speaking – most sit somewhere between UBC and McGill, which is to say quite big, but not “big-league” big.
Figure 3: Total Annual Expenditures, in Billions of USD, C9 Universities and Select Canadian Universities, 2020
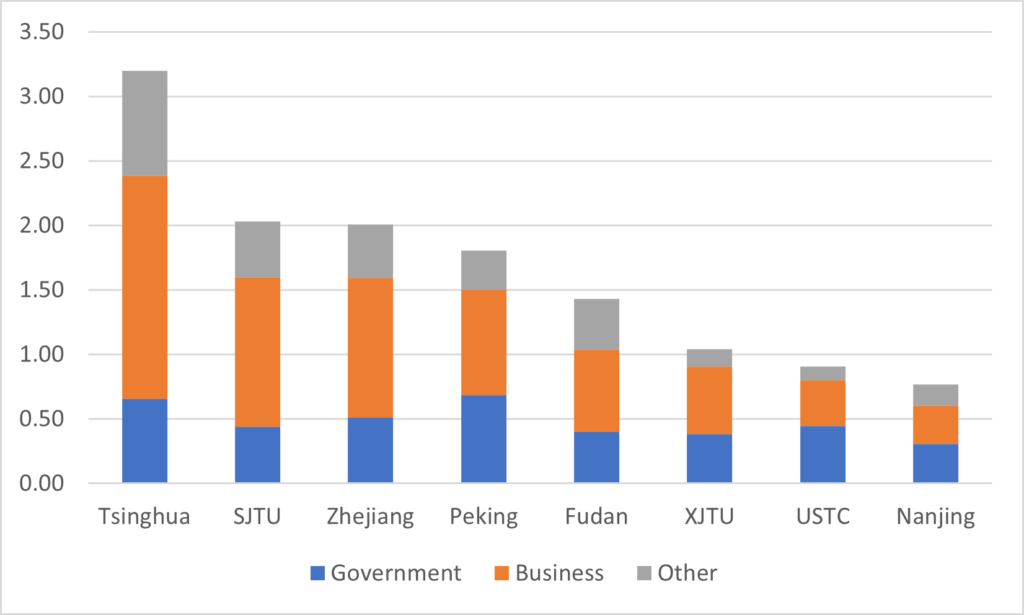
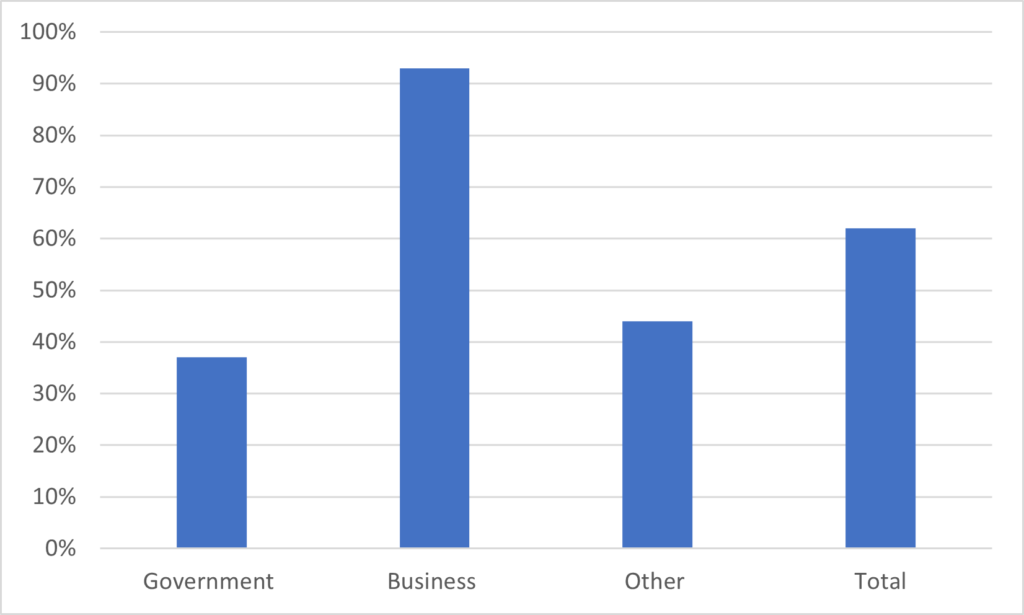
Now let’s examine these universities’ incomes by source. In Chinese university accounts, the three main listed sources of funding are “government”, “business” and “other” (I don’t exactly know what the difference between the second and third is, though if I had to guess I’d say tuition fees are in the third category). Figure 4 shows that none of these top 5 universities receive over half their funding from public sources. In fact, across the group as a whole, public funding only accounts for 30% of total funding, which means their overall income patterns are fairly similar to universities around the world. Even so, these eight institutions, which together make up about 0.6% of total enrolments, are capturing a little over 3% of total public funding, implying that the per-student subsidy at these institutions is something like five times the national norm.
Figure 4: Income by Source, in Billions of USD, C9 Universities, 2020
Given our determination that increases in public funding have more or less flatlined, it’s worth looking at how the C9 universities income patterns have changed. This is shown below in Figure 5. Here we see two key things. First, public expenditures at these institutions have risen more quickly than the national average and second, non-government income sources are rising more quickly than income from public sources. In other words, despite the overall slowdown, these top universities are doing just fine and in all likelihood are extending the gap between themselves and the rest of the pack.
Figure 5: Change in Aggregate Income by Source, C9 Universities, 2013 to 2020
In brief: yes, China has an enormous higher education system, including a number of elite universities. But the system is highly stratified: fewer than 20% of all students are in comprehensive universities and well under one percent are in institutions which resemble prestigious Canadian universities. Recent caps on funding growth means the supply of places in “good” universities is unlikely to increase much. This scarcity helps to explain the pressure around obtaining gaokao results that permit entry to top schools; it also explains the persistent demand for studying abroad.

 Tweet this post

Years ago, I briefly taught at a small specialized university in North-Western Beijing. At that time, the university was in the process of merging its campus with another institution next door, a ‘finance university’, managed by the Bank of China. I was told at the time that the merger was part of a process instituted by the Chinese government to gradually change from the old Soviet-style system you mention (specialized universites managed by their respective ministries, with a ministry of education responsible only for the big insititutions and the so-called ‘normal’ or teaching universities), to a more western style of comprehensive universities under an education ministry. Looking at your analysis, it looks as though, at least in this regard, not much has changed at all!