


One of my distractions over the past summer has been to learn more about Chinese universities. And, fortunately, this is becoming a lot easier as Chinese universities are starting to put more of their data online. Today, I just want to take you through a bit of a tour of China’s top universities (roughly the equivalent of the US Ivy League), which are known as the “C9”, most of which now put their financial data online.
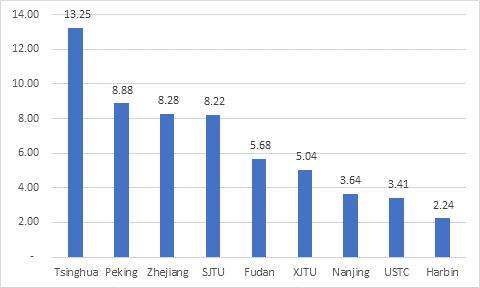
So let’s start just by looking at raw annual expenditures (I prefer using expenditures to income as a guide to a university size because it tends to be more stable year-to-year) at these top universities. Figure 1 shows this by institutions for the 2015 calendar year. Tsinghua leads the pack by a wide margin, at a little over RMB 13 billion. Peking, Zhejiang and Shanghai JiaoTong are next at between RMB 8-9 billion Yuan, Fudan followed by Fudan Xi’an Jiao Tong at between RMB 5-6 billion. The bottom positions are held by the two C9 universities which do not report to the higher education ministry: the University of Science and Technology of China (Chinese Academy of Science) and the Harbin Institute of Technology (Ministry of Industry and Information Technology) at RMB 3.4 billion and RMB 2.2 billion, respectively.
Figure 1: Expenditures, in Billions of RMB, Top Chinese Universities, 2015
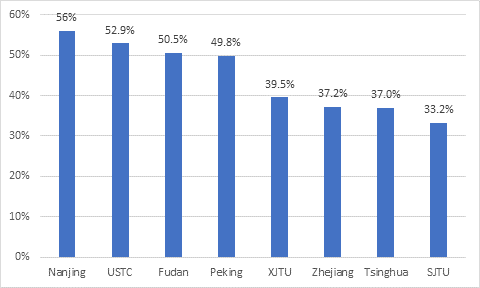
One interesting piece of information about these institutions is how little of their annual budget actually comes from government. Figure 2 shows government appropriations as a percentage of annual expenditures (Harbin Institute of Technology is excluded because its financials do not distinguish between public and private sources of revenue). As it turns out, top Chinese universities actually look a lot like Ontario ones in that they tend to get less than half their money from government. That said, at most institutions student fees only account for about 15% of total revenue.
Figure 2: Government income as a % of total expenditures, Top Chinese Universities, 2015
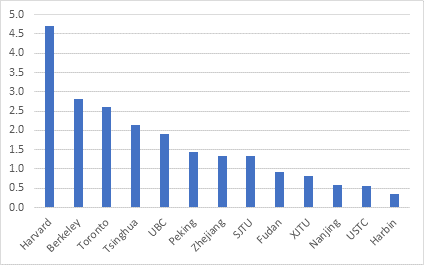
Now at this point you may be wondering: RMB 13billion….is that a lot? A little? What’s the frame of reference here? Well, fair enough. Let’s put all this into US dollars, just so we’re clear. And for reference, let’s throw in data for Harvard, Berkeley, U of T and UBC for 2015-16 for comparison. To do this, I’m converting to USD at the mid 2015 exchange rate of RMB 6.21 = CDN $1.29 = USD $1. The results are shown in Figure 3: By this measure, only Tsinghua is really up in the North American big leagues.
Figure 3: Total Expenditures, in USD, Top Chinese Universities plus US/Canada Comparators, 2015
But hang on a second. What if we use purchasing power-parity instead of exchange rates? Well, actually, this changes things more than you’d think. If you convert the data at the mid-2015 Big Mac Index rate of RMB 3.55 = CDN $1.22 = USD $1.
Figure 4: Total Expenditures, in billions of USD at PPP, Top Chinese Universities plus US/Canada Comparators, 2015
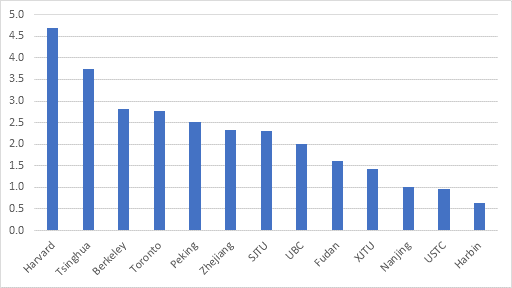
Once adjusted for PPP, Tsinghua moves closer to Harvard, and the next three are more obviously in the big leagues, having all passed UBC. Now in fact, PPP probably overstates universities’ buying power somewhat, because for many of the goods what universities purchase (top professors, scientific equipment, etc), the price is global rather than local. So if you want to think about relative purchase power, a fair comparison between the institutions is probably somewhere between figure 3 and figure 4.
(If we were to do this from the perspective of “how big is each institution relative to the size and development of the economy” – that is, adjusting for GDP per capita, all the Chinese institutions would rise by a factor of four relative to American ones, i.e. Tsinghua would be three times as large as Harvard.
Now, what about dollars per student? For this, I take the student numbers the institutions report to Quacquarelli Simons (QS) for use on its “top universities” website. You can take these with a grain of salt: I can’t get QS’ numbers to line up with the data I have directly from any of these institutions, but it’s the most consistent thing we’ve got, so we’ll just have to live with it.
Figure 5: Expenditures per Student, in USD at PPP, Top Chinese Universities plus US/Canada Comparators, 2015
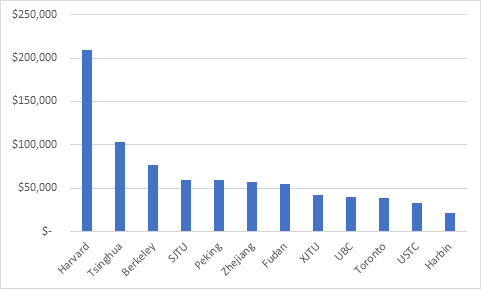
Now Tsinghua is much more clearly in an Ivy-League-approaching kind of position, with expenditures of over $100,000 per student. That’s not near Harvard, which spends about twice that, but it is a full 25% higher than Berkeley and 150% higher than UBC and Toronto. Even the Chinese second-tier trio of Shanghai Jiao Tong, Peking and Zhejiang are spending 50% more per student than the top Canadian universities.
In short, the top Chinese universities aren’t, as it is sometimes said, “rising”. Financially, they’re already comfortably part of the world elite.

