I was just running the numbers on student debt in Ontario. They are interesting.
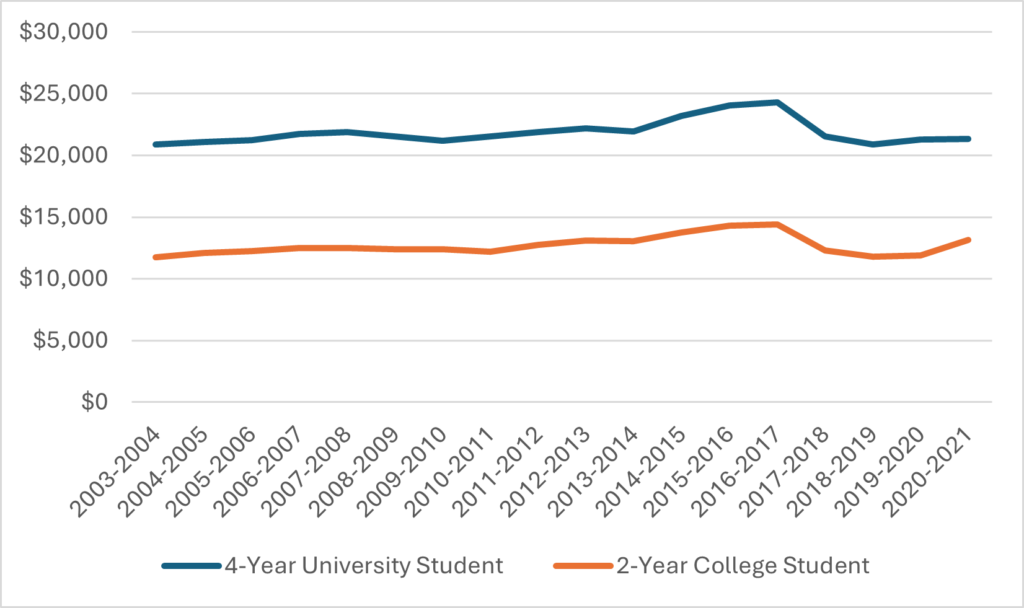
Time used to be that the Provincial government published these numbers on its own. This Ontario open data set has data from 2003-04 to 2011-12. Since then, I have been filing FOI requests and the government have been providing identical basis. Figure 1 shows the results, according to the administrative data held by the Government of Ontario. Turns out that based on this data—which should be the most accurate available—student debt in 2020-21, far from “skyrocketing,” was actually right about where it was in 2003-04: roughly $21,000 for bachelor’s graduates and $12-13,000 for graduates of 2-year college programs. Debt did rise somewhat in the mid-10s, but then fell because of the Wynne government’s targeted free tuition program which the Ford government cancelled in 2019; you’d expect numbers to have risen back towards 2016 levels since the end of this time series.
Figure 1: Average Debt at Graduation, Students with Debt > $0, Ontario, 2003-04 to 2020-21

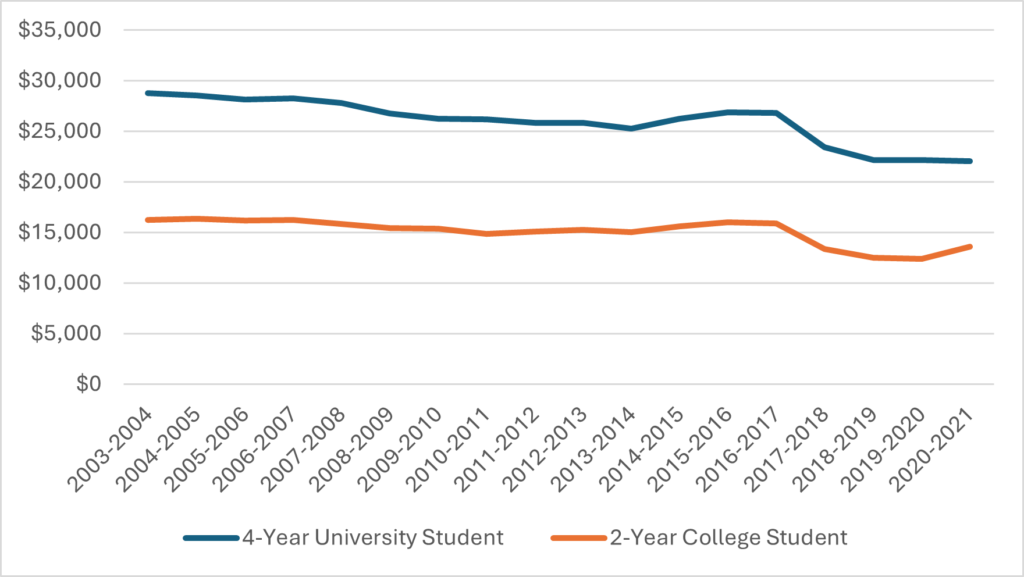
Oh wait. Hang on. I got that wrong. That’s in nominal dollars. Figure 2 shows what it looks like in real dollars; that is, after inflation.
Figure 2: Average Debt at Graduation, Students with Debt > $0, Ontario, 2003-04 to 2020-21, in real $2021

You are not seeing things. In real terms student debt for bachelor’s graduates fell by 30% between 2003-04 and 2020-21. And for 2-year college graduates it fell by 19%. It did not rise. It fell. By a lot.
So why does everyone think it’s been rising?
Well, obviously part of the issue is just cliché and repetition. If student groups and the NDP say debt has been “skyrocketing” for long enough, it becomes true. It’s a bit more puzzling why the Government of Ontario never has made a bigger deal of this is more of a puzzle (especially when the Liberals were in power, since this chart comes close to bookending their regime entirely, from fall 2003 to the dismantling of their targeted free tuition plan in early 2019).
But another possibility, one to which we should pay more attention, is simply that the way we measure student debt isn’t all that accurate. Generally speaking, the big data sources of student debt information—the National Graduates’ Survey being the main one—are survey-based. That is, data on graduate debt is obtained simply by asking “how much student debt did you have when you graduated?”
Now: how accurately do we think students can answer this question? Particularly since this question gets asked three years after graduation?
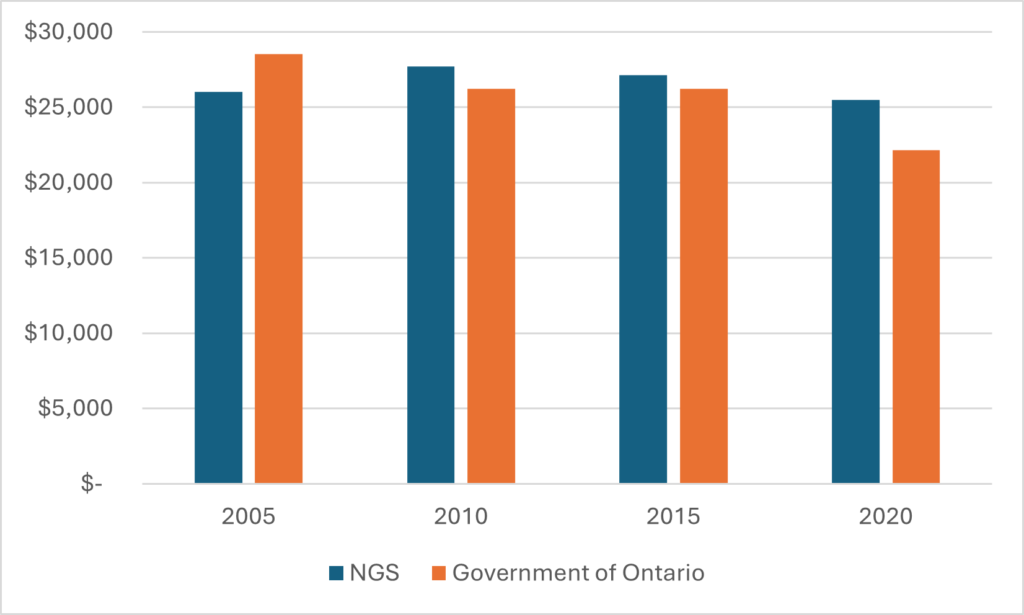
In Figure 3, I show the NGS’s estimate of average student debt at graduation vs. the actual average based on administrative data. For the four years where we have observations from both NGS and the provincial administrative dataset, on average, the student estimate was off by a bit over $2,000. The error is not all in one direction: sometimes it is an over-estimate compared to what the administrative data tells us, and sometimes an underestimate.
Figure 3: Reported Student Debt at Graduation, Ontario, National Graduates Survey vs. Government Administrative Data, select years 2005 to 2020, in real $2021

Why can’t Statistics Canada access administrative data on debt of students at graduation? The answer is that only the provinces hold data on combined federal and provincial student loans. And StatsCan either has not bothered to try to link into this data or provinces have refused to allow them to link (unsure which of these is true). So we’re stuck with an obviously error-prone source even though as Ontario shows, actual data is clearly available. It’s just that provinces don’t for the most part actually publish this data.

 Tweet this post

I work with PSE students, so I have stories. Now stories aren’t reliable data, obviously, but they can offer the story behind the numbers or, more interestingly in some cases, tell us where else we might look for more numbers and get a more comprehensive story. Over my last 25 years of work, I would say the number of students working multiple jobs and long hours, as well as those accessing private, non-student loan debt seems to be going up (I say seems because my anecdotes aren’t enough – but it would be an interesting compliment to this analysis). The former could point to (a) we capped how much gov’t debt they can incur but going to school is getting more expensive so students have to work more (meaning that privileged students have yet another advantage in the competition to get the best grades (to get into competitive entry programs that lead to better paying jobs) and the latter would mean that we aren’t seeing the real debt numbers. But it certainly is possible that although school is getting more expensive, debt isn’t going up – and it might be smart to figure out why.
A couple others factors to consider re: the lack of increase in student debt between 2003-04 and 2020-21 are that the 2020-21 bachelor degree data includes academic years when the ‘free tuition’ policy was in place and that CSGs were doubled in 2020-21.
“Now: how accurately do we think students can answer this question? Particularly since this question gets asked three years after graduation?”
Well, fair enough, but it leaves us asking why five years ago they suddenly started all making a mistake in a particular direction.