


Morning all. Yesterday, we looked at details of university expenditures over time: today we will look at how universities spend their money. I am not going to show any of this in dollar terms, because as can be inferred from yesterday’s blog, all spending is way up over the past couple of decades (about 90% after inflation), and it is up across almost every category of expenditure. Instead, what I am going to do is express expenditures on various line items as shares of total expenditures. Forewarned, forearmed, etc.
Figure 1 shows changes in total expenditures by type. For these purposes I collapse a couple of dozen different spending categories into just six: salaries (including benefits), expenditures related to acquisition and maintenance of buildings and grounds, purchases of materials and supplies (including library acquisitions), scholarships, professional fees & contracted services, and everything else. Figure 1 shows how spending has changed across these categories over the last twenty years at five-year intervals.
Figure 1: Share of Total University Expenditures, by Type, Selected Years, 2000-01 to 2020-21
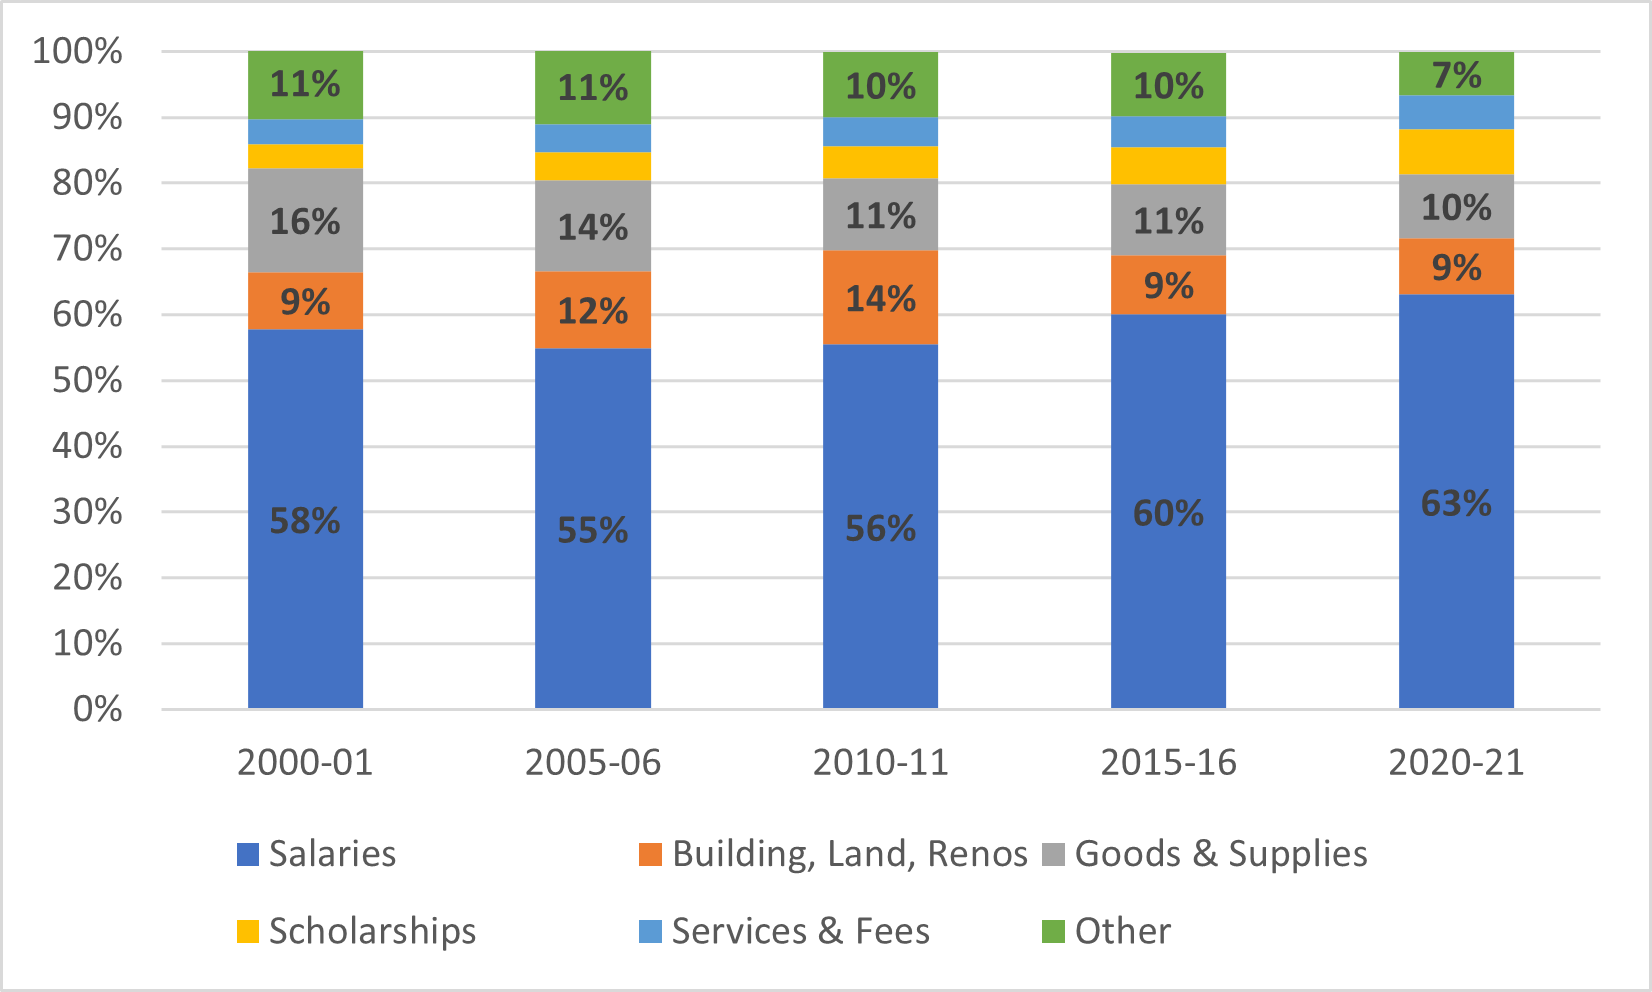
There are two significant take-aways from Figure 1. The first is that universities are spending a lot less money on physical things than they used to. Twenty years ago, roughly a sixth of all expenditures went on goods and services: now it is about one-tenth: printing budgets are lower in nominal terms (not just inflation-adjusted ones) than they were 20 years ago when there were far fewer students. Buildings, which took up 14% of all expenditures ten years ago, are back down to just 9% now. The second is that what is taking up more money are salaries and scholarships (or actually, all aid to students, which includes some need-based aid, but the majority is merit-based and targeted at graduate students). The proportion of university expenditures in both these areas hit an all time high in 2020-21.
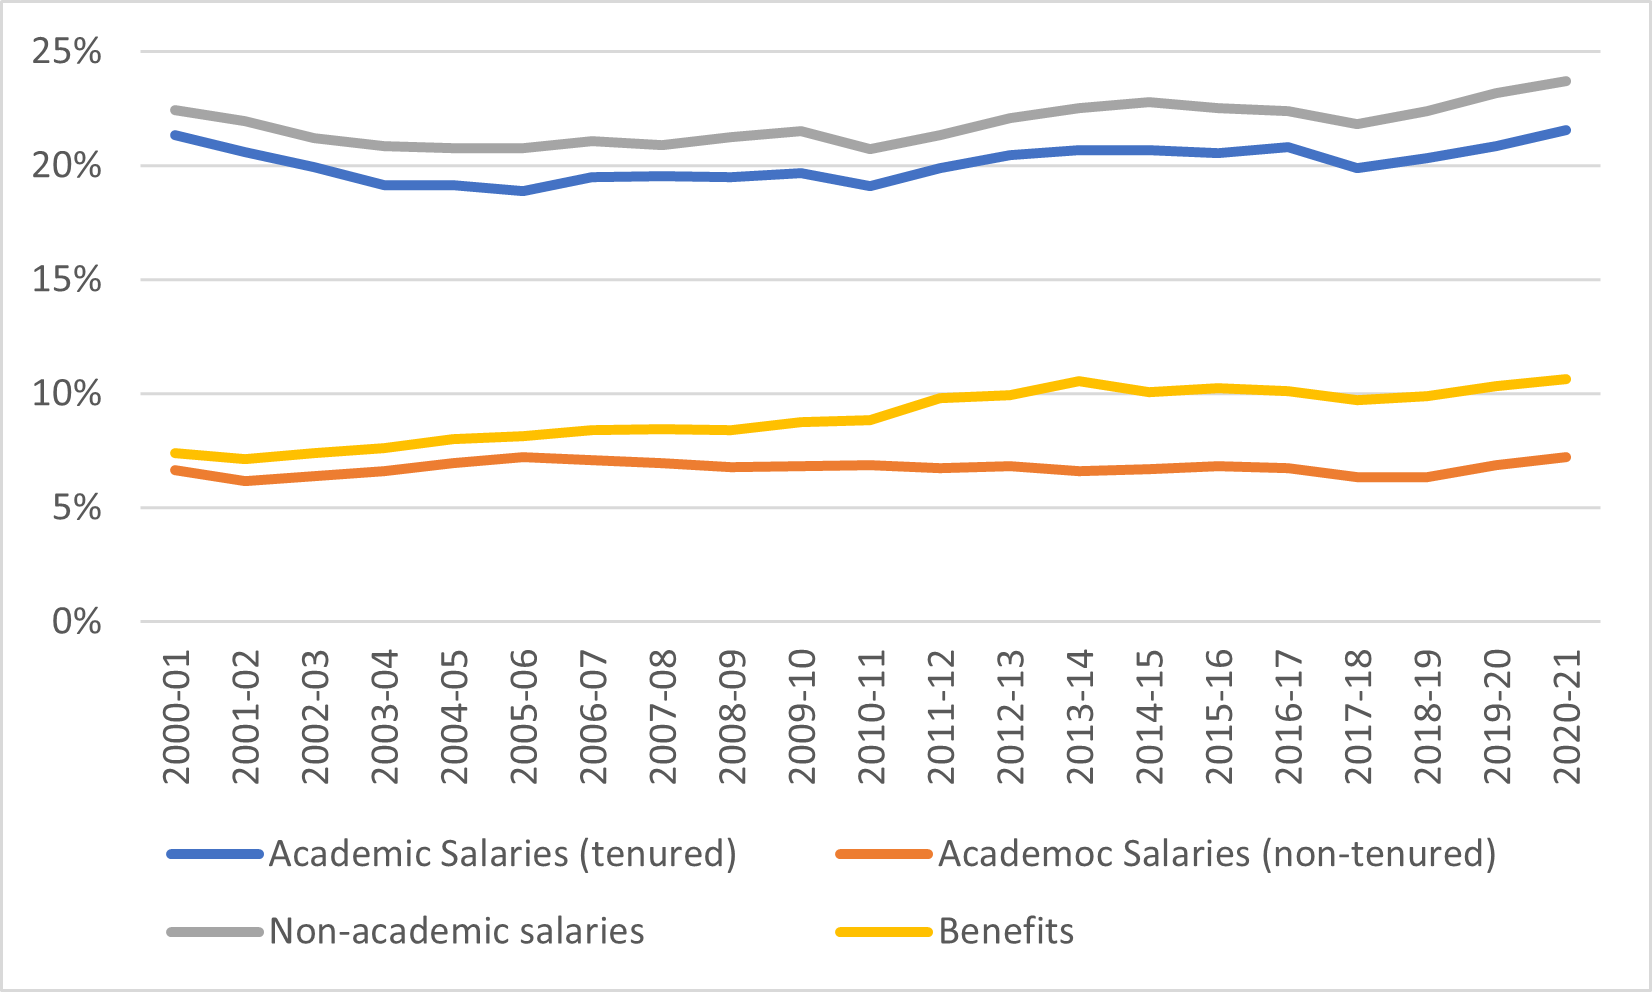
Let’s drill down a bit on the salaries and benefits numbers. At one point in the mid-2000s, total compensation costs fell to as low as 54% of total expenditures, and academic salaries specifically fell below 20%. However, as Figure 2 shows, there has been a long slow climb since that time: in 2003-04 aggregate compensation was 53% of a $27.5 billion total expenditure budget (adjusted for inflation), and by 2020-21 it had morphed into 63% of a $38.7 billion budget. And this compensation increase was broadly-based, with increases going to academics and non-academic alike, though proportionately the biggest increase was in benefits rather than in salary packages.
Figure 2: Aggregate Compensation, by Type, as a Share of Total University Expenditures, 2000-01 to 2020-21
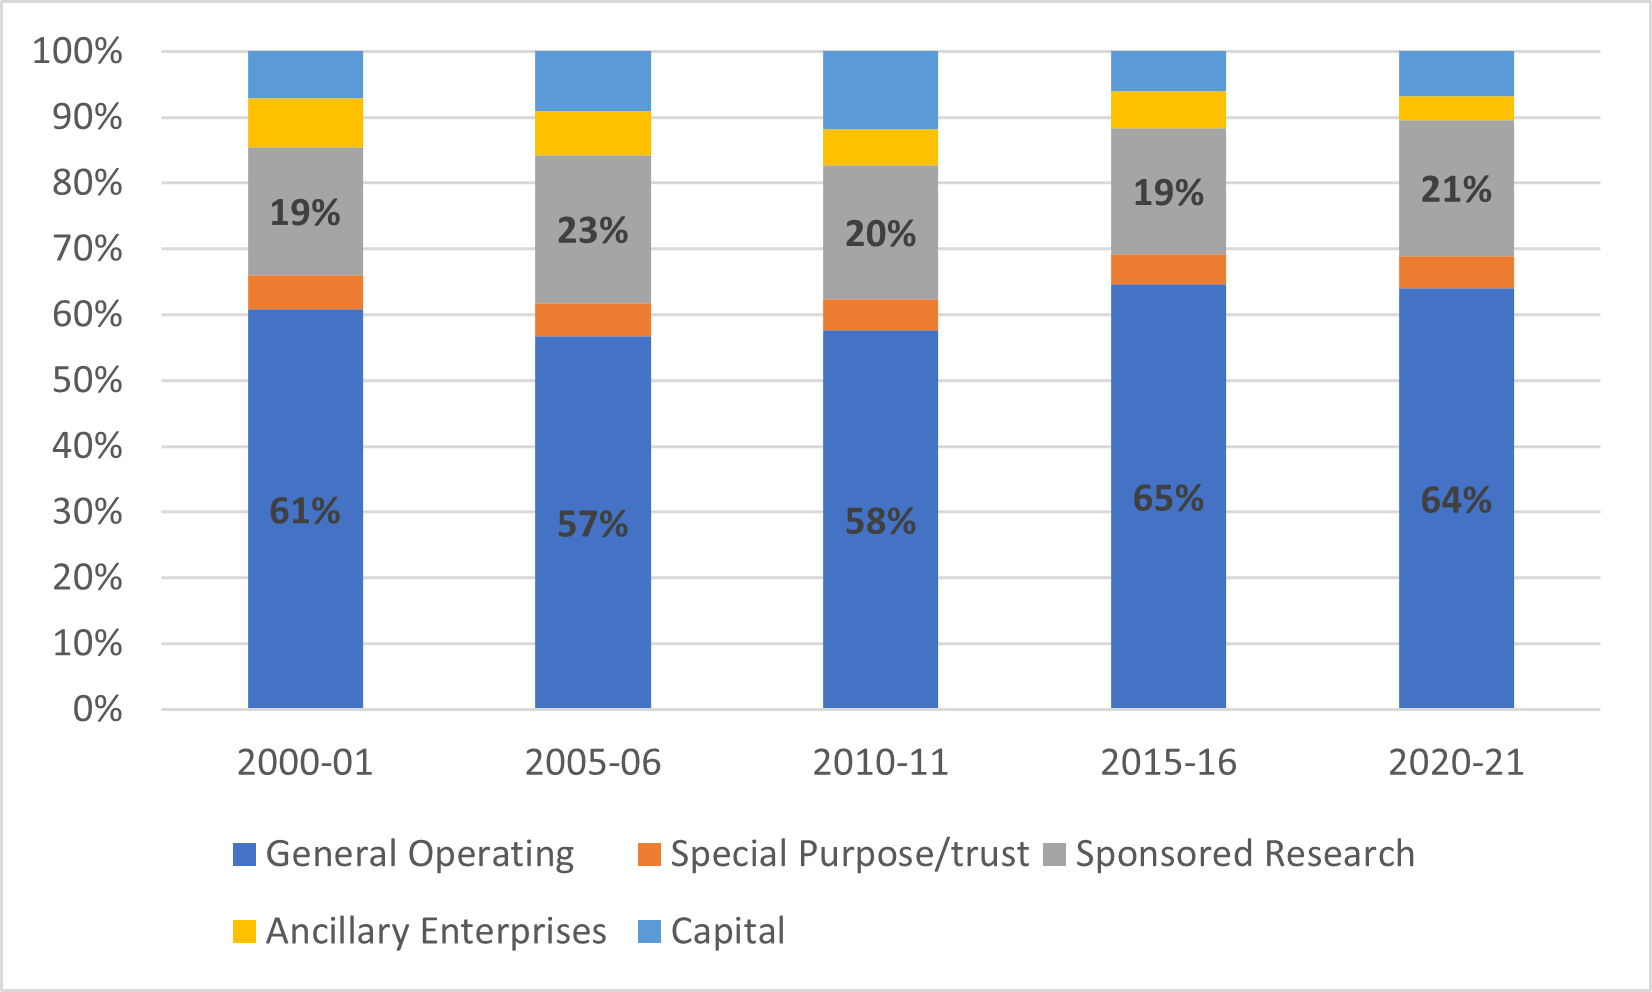
So that’s the story on expenditures by type. Let’s turn to expenditures by function. There is much less of a story to tell here. General operating expenditures have inched higher as a proportion of total expenditures over the years (no doubt driven by the expansion of salaries noted above), while sponsored research is down a bit since the highs of the mid-oughts. A couple of observations here are clearly outliers: capital expenditures were a big portion of the total in 2010-11 when everyone was still busy spending federal counter-recession infrastructure dollars, and ancillary operations are abnormally small in 2020-21, because, well, campuses were mostly closed, and a lot of ancillary enterprises were shut.
Figure 3: Shares of Total Expenditure by Function, Selected years, 2000-01 to 2020-21
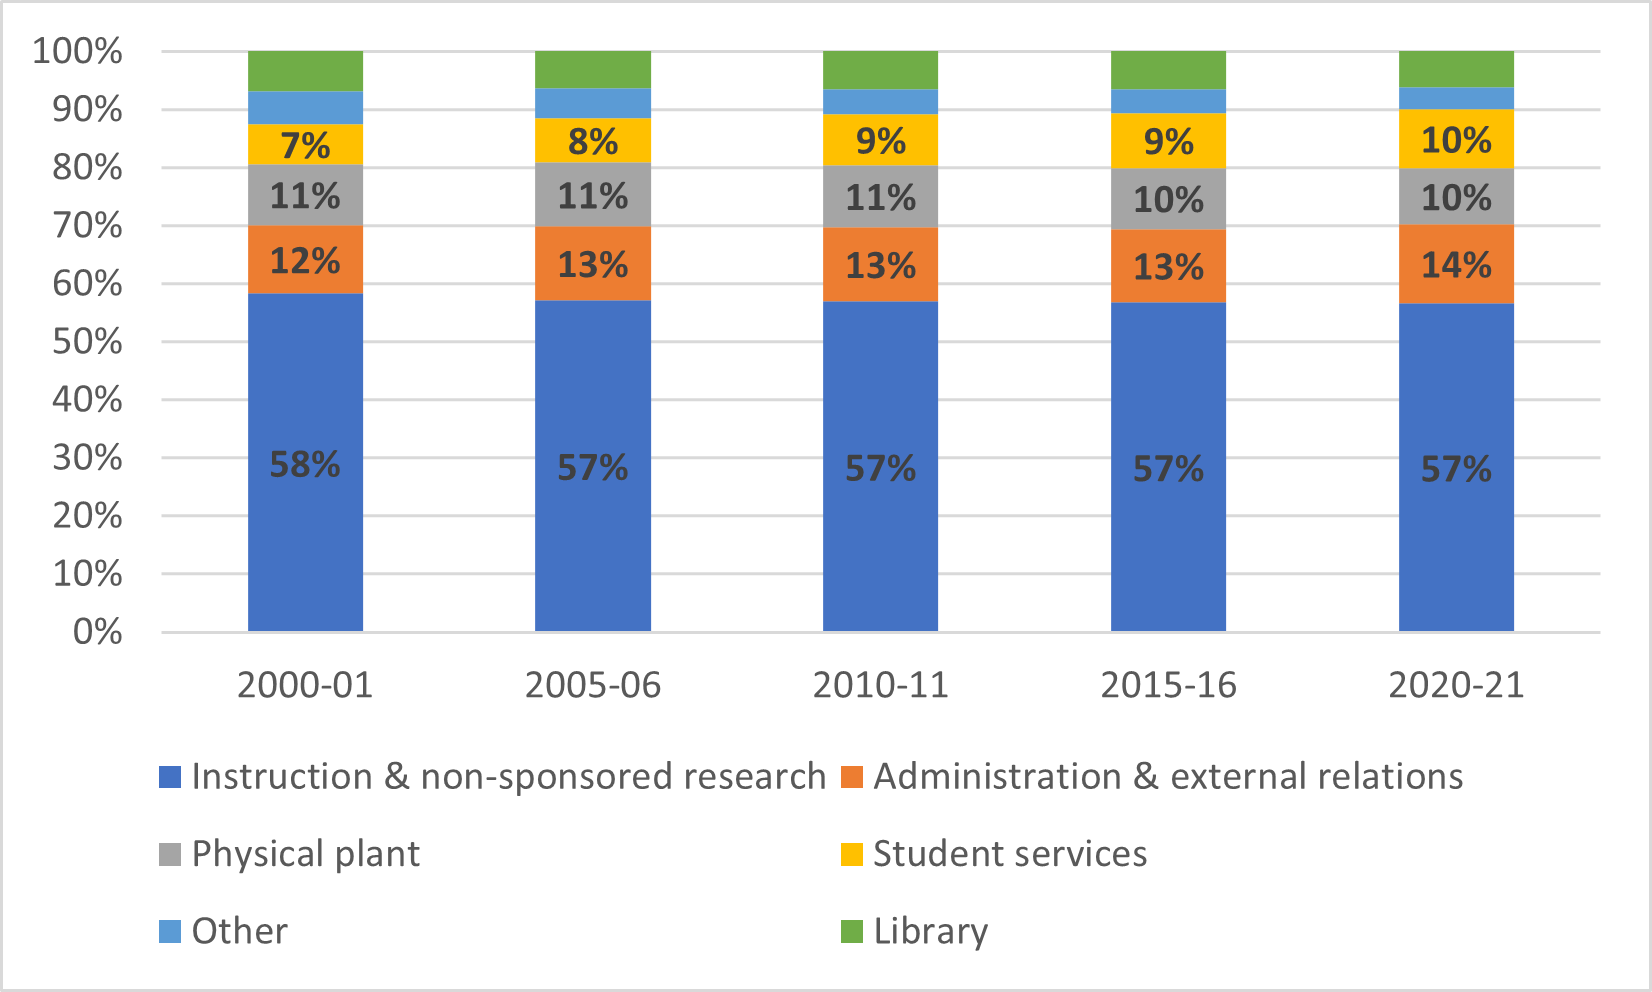
We can drill down a little bit within the operating budget, although to be honest this is a bit of an exercise in monotony because almost nothing has changed in terms of distribution of operating budgets over the last 20 years. The proportion devoted to instruction & non-sponsored research has varied all the way from 56 to 58%, physical plant from 10 to 11%, etc. The biggest declines have been libraries (down from 6% to 4% of total expenditures), while the biggest increases have been in student services and, to a lesser extent, administration and external relations.
Figure 4: Shares of Toral Operating Expenditures by Function, Selected Years, 2000-01 to 2020-21
In any event, the main takeaways from this should be: first, that institutions, contra much chatter about budgets being taken over by capital expenditures, are actually becoming more labour-intensive over time; second, that academic salaries are increasing as a share of total expenditures; third, administrative expenditures are rising as a share of expenditures but less so than student services and apparently not at the expense of the instructional budget; and fourth and most importantly, expenditure patterns for the most part really don’t change that much over time.

