


I haven’t done a deep dive into university finances into a couple of years, so I thought I would take a couple of days to look through the latest data from the Financial Information of Universities and Colleges survey (confusingly-named, since it does not include community colleges). Today I’ll do revenues, and tomorrow expenditures.
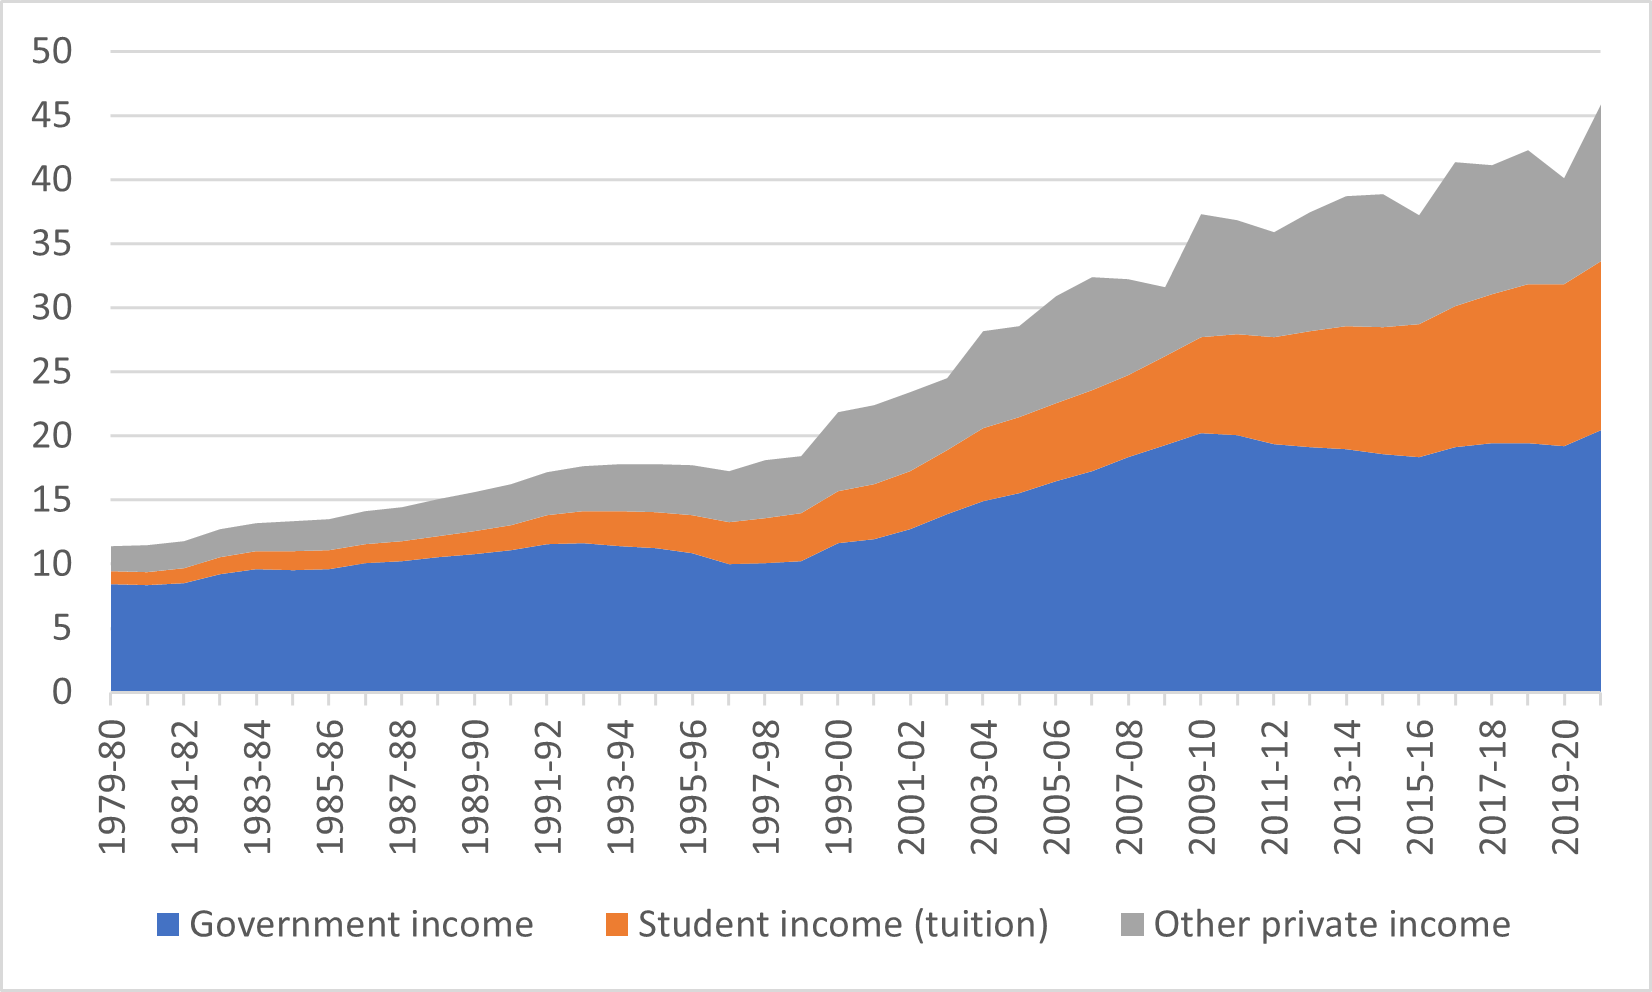
Let’s start with the simple long-term change in revenues. Far from being in an “austerity” situation, universities have been growing their total income at a rate well above inflation for the better part of forty years (the only exception being during an actual age of austerity in the 1990s. Financially speaking, the system is now about four times the size it was in 1980, even after accounting for inflation.
Figure 1: Total Income by Source, Canadian Universities, 1979-80 to 2020-21, in Billions of $2020
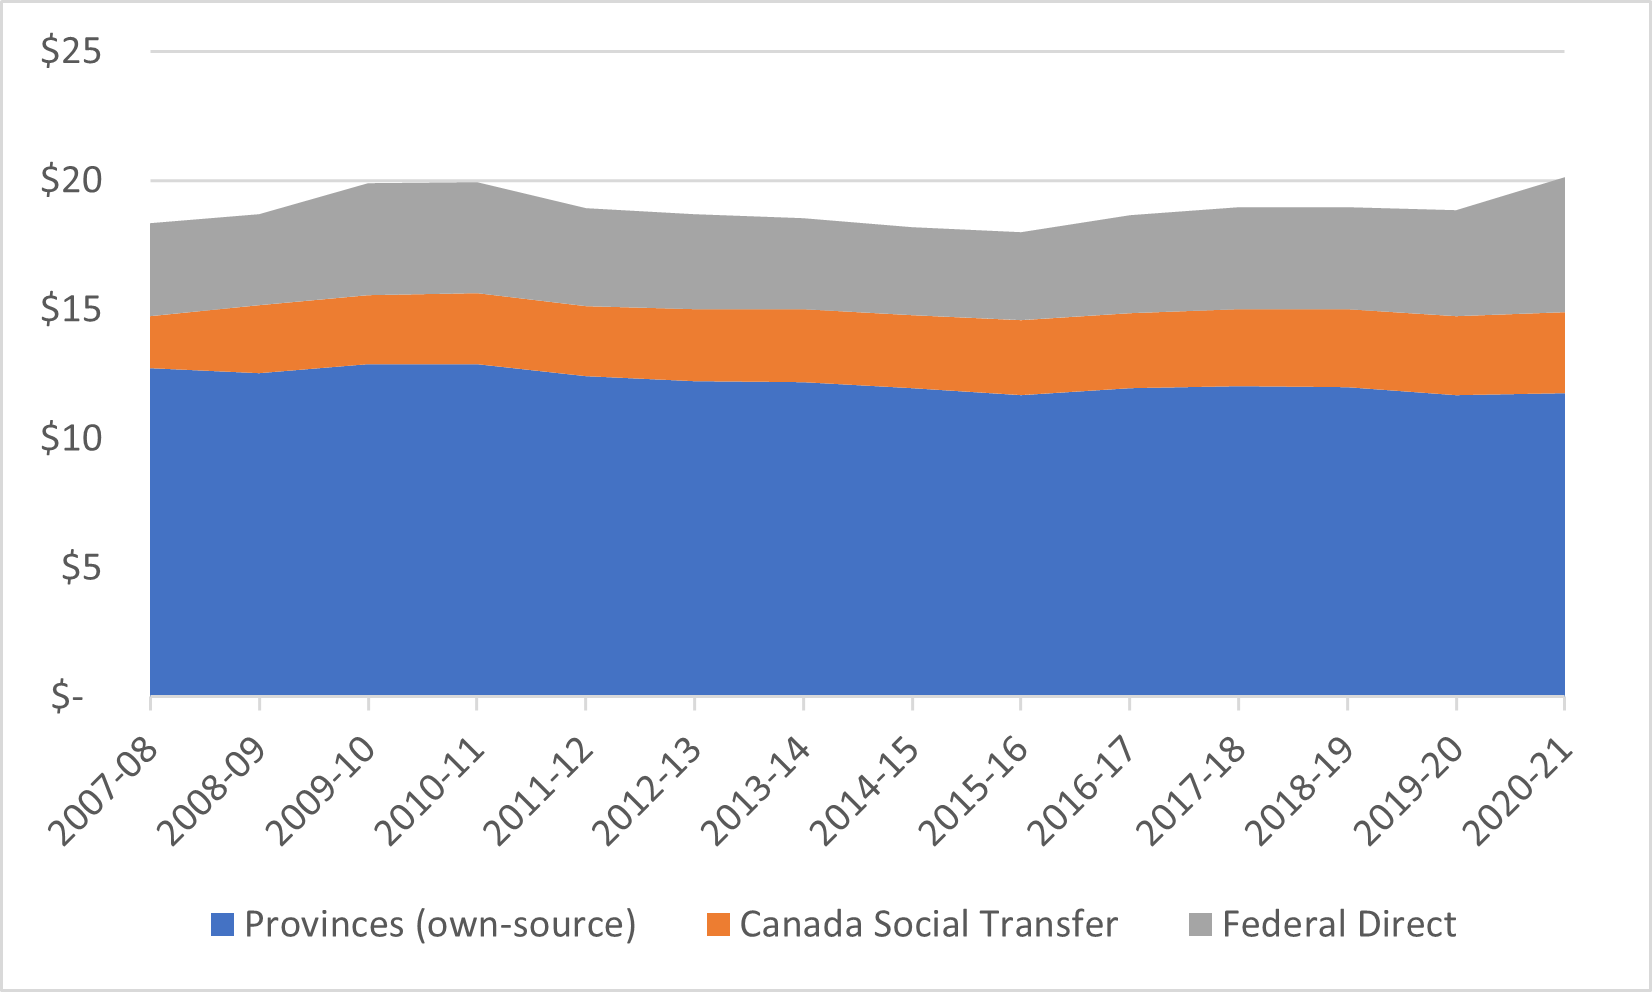
But as I always point out, public money has been more or less flat for over a decade now (there was a bump in 2020-21 but it was a temporary, COVID-induced bump). Figure 2 shows universities’ public money by source, with the provincial portion divided into “own-source” funding and the amount derived from the Canada Social Transfer (which can be considered either as provincial or federal funding, depending on your priors about fiscal federalism).
Figure 2: Income from Governments, by Source, Canadian Universities, 2007-08 to 2020-21, in Billions of $2020
In the absence of public money, universities have sought to keep their income rising steadily through student fees, which doubled in real terms between 2007-08 and 2020-21. Universities do not as a rule declare how much of their income comes from domestic and international sources, but rough math based on student numbers and the gap between domestic and international numbers shows that roughly 70% of the total increase in fees since 2007-08 – and fully 93% since 2015-16 – comes from international student tuition.
Figure 3: Income from Students, by Source, Canadian Universities, 2007-08 to 2020-21, in Billions of $2020

So far, so good. You guys probably knew all of that already. But what about that “other” income – income which doesn’t come from either government or students, and which makes up slightly more than one-quarter of all income. What does that look like?
Broadly, there are 5 categories of income which get lumped together under “other”: “Donations”, which consist of voluntary transfers of cash without expectation of return; “grants”, which provide financial support under certain stipulated conditions including the deliverable of a product; “sales of services”, which includes a variety of things of include rent on space (including residences and parking), payments bout any regular income not covered by the previous three areas, and “investments” which mostly means returns on endowment but does include a small amount of returns on other kinds of assets as well.
Figure 5 shows that a number of things. First and most importantly, it’s that investment returns are volatile. In some years they are zero or even negative, while in other years – like 2020-21 – they can be over $5 billion. Second, though it may not be entirely obvious from the graph, the main casualties of the pandemic were sales of services and “other revenues”, which fell by about 40% in a year when campuses were mostly empty. Third, the category that has increased the least over the last twenty years is “donations”, which has only increased by about 29% since 2001-02 and effectively not at all since 2007-08.
Figure 4: Income from “Other Sources”, by Type, Canadian Universities, 2001-02 to 2020-21, in Billions of $2020

Meaning that, despite all the talk one sometimes hears about “corporatization” of higher education, in fact “grants” from private sources are basically unchanged at 6% of total income over the past fifteen years, while “donations” have fallen from five percent to three percent of total income. To the extent “private” sources of income are on the rise, it’s entirely down to international students and investment returns. A summary of income sources is presented in figure 5.
Figure 5: Share of Income, by Source, Canadian Universities, 2007-08 to 2020-21, in Billions of $2020
Another way of looking at university income over time is to look at income by fund: that is, where in the institution the money is going. And the answer is that viewed this way, things really are not changing very much at all. The percentage of total income going to operating budgets have increased very slightly, the percentage going towards sponsored research is down very slightly, while the other areas are relatively unchanged.
Figure 6: Share of Income by Type, Canadian Universities, 2007-08 to 2020-21

Tomorrow: Trends in Expenditures.


2 Responses
“Meaning that, despite all the talk one sometimes hears about “corporatization” of higher education, in fact “grants” from private sources are basically unchanged at 6% of total income over the past fifteen years, while “donations” have fallen from five percent to three percent of total income.”
This is entirely missing the point of such complaints, which posit that those relatively small income streams have a wildly *disproportionate* impact on decision-making at universities, particularly with regard to research, hiring, and infrastructure priorities, and often in a way that bypasses or otherwise subverts normal decision-making processes. These are fundamentally complaints about qualitative issues of internal decision making that aren’t obviously going to show up in any sort of large-scale quantitative metrics.
Examples of disproportionate impacts across the sector as opposed to anecdotally, please.