You may all have seen the recent University World News article about HESA’s big new publication, World Higher Education: Institutions, Students, and Funding (written by Jonathan Williams and myself), which is actually going live on March 31st. For the next few weeks, you’ll be getting some deep dives into the biggest stories that our data has thrown up. And today I want to talk about the biggest story of them all: the rise of the Global South.
(Small methodological note: our data cover 56 countries which collectively comprise well over 90%+ of all global enrolments. “Global North” for us means Europe, the ex-Soviet Union, Canada, the US, Australia, New Zealand, Japan, South Korea, Taiwan, Singapore and Hong Kong; “Global South” means everyone else. The lines aren’t strictly about national GDP levels – they are also mediated by historical factors – but they are close).
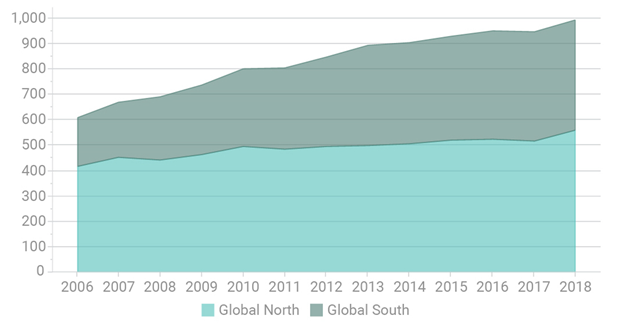
Let’s start with the big picture with respect to enrolments. The Global South passed the North in enrolments around the turn of the century, but the extent to which the gap has widened since 2006 is quite extraordinary. In the North, total enrolments have fallen, partly due to demographic factors in Eastern Europe and Russia, and partly due to the fall in short-cycle enrolments in the United States. But the South has seen consistent growth. In 2006 the region has 80 million students; in 2018 it had approximately 150 million. In Canadian terms, it’s as if a Dalhousie joined the world’s higher education system every single day for twelve years.
Figure 1: World Higher Education Enrolments, 2006-2018, in millions.

Figure 2 shows that this growth was hardly concentrated in a single region. East Asia accounts for the largest share of students in the Global South, but partly for that reason it also has the slowest overall rate of growth (66% over 12 years). The fastest rates of growth were actually in South Asia (140%) and Sub-Saharan Africa (124%). These two areas will have both the world’s lowest enrolment rates and the world’s highest enrolment growth rates, and be the focal point for higher education development for the foreseeable future.
Figure 2: Total Enrolments by region with the Global South, 2006-2018, in millions
Now let’s look at changes in funding. As shown below in Figure 3, between 2006 and 2018, the percentage of domestic GDP accounted for by public spending on higher education funding stayed relatively constant across the Global North, at between 0.9 and 1.0% of Gross Domestic Product. This shouldn’t be a surprise: it’s hard shifting public funding in wealthy democracies. But look at the Global South: between 2006 and 2013, public expenditure on higher education rose from just over 0.6% to 0.8%, thus partially closing the gap with the North. But note that this growth halted thereafter: in large part that’s due to the halt in spending growth that occurred in China after Xi Jinping’s accession, and to a lesser degree countries like Indonesia, Nigeria and Saudi Arabia adjusting to the fall in oil prices after 2014.
Figure 3: Total Public Expenditures on Higher Education as a Percentage of Gross Domestic Product, 2006-2018
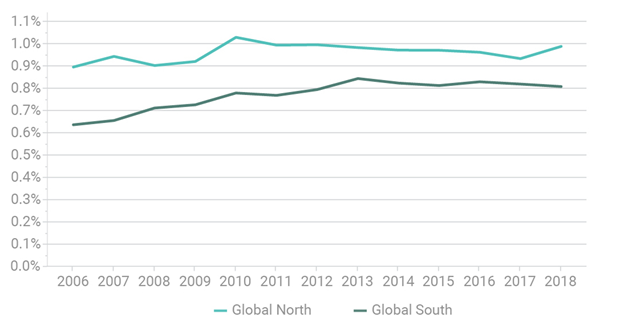
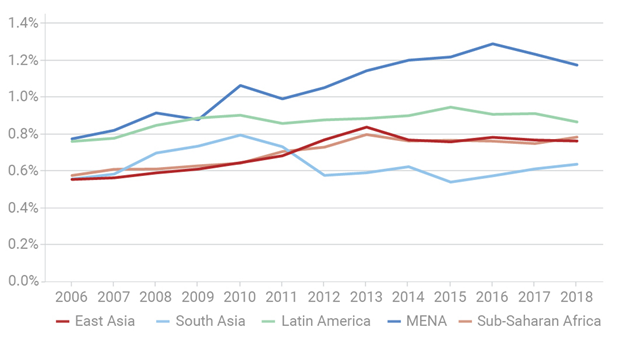
Figure 4 reminds is that there’s a great deal of diversity in spending patterns across the Global South. Funding is more generous in the Middle East and North Africa (an area which also includes Turkey and Iran) than it is in, say, South Asia. That said, all the regions within the global South had higher public spending on higher education as a percentage of GDP in 2018 than they did in 2006.
Figure 4: Total Public Expenditures on Higher Education as a Percentage of Gross Domestic Product, by region, 2006-2018
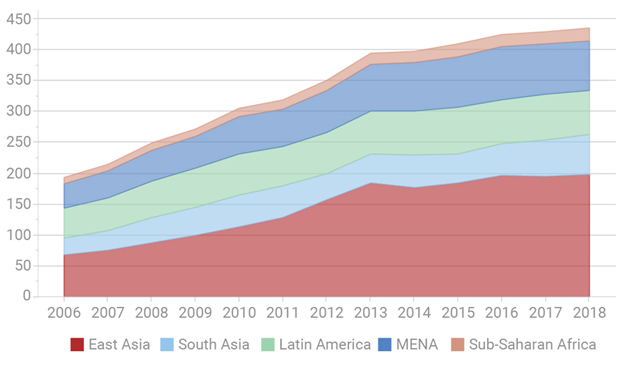
Now, how does this all translate into dollars? On this measure, the effort of Global South countries looks much better, because GDP is growing more quickly there than in the North. This, even if spending as a % of GDP remained constant since 2013, in actual dollars spending has still grown because of wider economic growth. In total, annual public spending is up by over 100%, from $193 billion to $435 billion. Following this trend, total public spending on higher education in the Global South will pass that of the Global North sometime this decade.
Figure 5: Total Public Expenditures on Higher Education, in Billions of constant $2018 USD at PPP, 2006-18
But when in this decade? It’s hard to say. In dollar terms, the years of go-go-big spending increases ended some time ago. As Figure 6 shows, prior to 2013, real spending was increasing by 15.5% per year; since then it has slowed to just under 2% per year. However, inflation-adjusted spending levels did not actually decrease anywhere other than the Middle East/North Africa (MENA) region.
Figure 6: Total Public Expenditures on Higher Education, in Billions of constant $2018 USD at PPP, by region, 2006-18
Now here is where it gets interesting. Combine the data from Figures 1 and 5 and you get public expenditures per student in the North and South (see Figure 7 below) and you get a different picture again. In the North, slow expenditure growth combined with static or in some cases declining student numbers still means that expenditures per student are growing. This means – presumably – some kind of increase in quality or expansion of mission (to some degree this rally represents an increase in research intensity). However, in the South, something very different has happened. Public expenditure increased massively, yes, but only barely enough to cover growth in student numbers, meaning that in dollars-per-student terms the gap between North and South actually increased between 2006 and 2018.
Figure 7: Total Per-Student Expenditures on Higher Education, in constant $2018 USD at PPP, Global North v. Global South, 2006-18
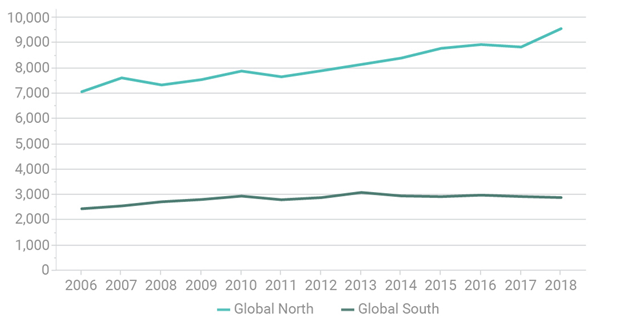
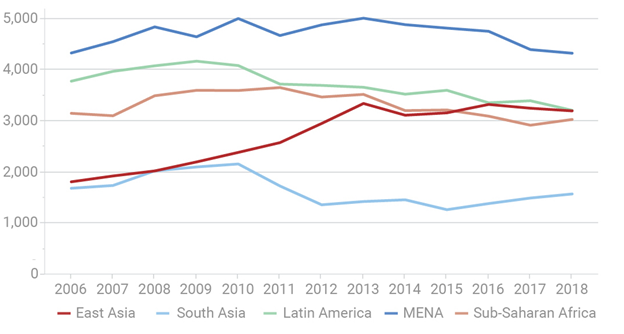
Figure 8 shows this even more starkly. Apart than East Asia (a region whose average is dominated by China), there is no region of the Global South where per-student expenditures increased between 2006 and 2018. Instead, what we mostly see is a rise in per-student spending in the early years of the period and a fall in later years.
Figure 8: Total Per-Student Expenditures on Higher Education, in constant $2018 USD at PPP, by region in the Global South, 2006-18
The broader point here is three-fold. First, there have been enormous strides taken in the Global South to expand enrolments and increase expenditures over the last two decades, and this is enormously heartening. The second is that something changed around 2013, and on the financial side if not the enrolments side, progress has been more halting since then. And the third is that this increasing money squeeze is forcing higher education systems in the Global South into ever-more difficult choices. Whereas in the period up to 2013, systems in the Global South could both welcome more students and aspire to greater quality and research-intensiveness, since then the choice between the two has become starker. On the whole, governments in the South seem to be choosing to use marginal dollars to expand access rather than improve quality. While that is a perfectly legitimate and democratic choice, one wonders about the opportunity costs in developing greater scientific and scholarly depth in many of these countries.

 Tweet this post
