Unless you’ve been in some sort of cave for the last decade, you’ve probably heard conversations about students, which begin with the phrase, “Today’s students are… less engaged/less able to write/weaker at math/not as curious/not as academically inclined…” The obvious question of “compared to when” is usually left unanswered, and depends to some extent on the age of the person doing the kvetching; solipsistically, I always assume they’re talking about 25 years ago (when I started university). Usually, the implication is that students are coming out of high school less university-ready than they used to be, and hence, that high schools aren’t doing as good a job as they used to.
So, is it true? Well, to start, we have to come to grips with what we mean by “students”. The student body of the 1980s looks a lot different than the student body of 2013 – and I don’t just mean in terms of the changing ethnic or age mix.
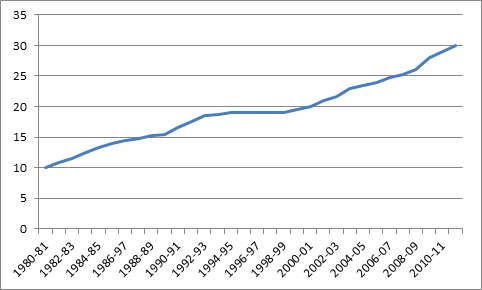
Take a look at the following graph, which shows the change in participation rate of 18-21 year olds in Canada, over time.
Participation Rate (in percent) of 18-21 Year Olds, Canada, 1980-81 to 2010-11
Cool, huh? We tripled access rates in thirty years. Remember this the next time you hear that accessible education is dead.
Now, assume for the moment that the fraction of Canadians who go to university are all at the top-end of the academic ability scale – that is, it was the 10% most academically able students in university in 1980-81, and it’s the top 30% now. I know that’s not literally true, but it’s true-ish, so bear with me. Today’s median student is therefore in the 85th percentile of academic achievement. Prior to 1988, when access rates were below 15%, we would not have even let that student into university.
Given this, it would be very surprising if today’s students weren’t, on average, academically weaker than those from 25 years ago. But it doesn’t follow that students coming out of high school are getting worse. To compare like-to-like you need to ask the question: is the average student of the top-half of this year’s university class better-or-worse prepared than the average student of 1988? Pose the question that way, and I think you get a different answer.
Expanding access to universities brought in a new type of student whose academic orientation was different – but the curriculum and the student support system didn’t always change to match their abilities and expectations. These are completely understandable reasons for the persistent disconnects and the complaints about “unprepared students” – but they don’t support the thesis that high schools are doing their job any less well than in the past.


 Tweet this post

1980? You must be a mere broth of a lad. I remember being told as a first year student in 1960 that our class did not compare in all the ways you mention with the returning vets going to university in the early ’50s on the GI Bill. One reason for the delay in dealing with the change that the graph presents so starkly, may be the hoary nature of the trope; on the other hand, taking action based on evidence is not an inevitable feature of large bureaucracies.
Hi Richard. I’m BA ’92, but the more important reason I stop at 1980 is b/c that’s where my data set ends and I;m too cheap to buy more (for a free email service, anyway). But yes, you could definitely move this argument back another 20 or 30 years and make the point even more strongly.
I quite like this: “taking action based on evidence is not an inevitable feature of large bureaucracies”. May I steal it?
You may. It is a small payback for wealth of interesting reading.
I’d like to see an analysis of the grade 12 marks presented for university admission over the decades as well. In my experience, the minimum marks for entering a university program have climbed beyond all reason, meaning that many of yesterday’s university students, who have gone on to very successful careers in their fields, would have no chance of being admitted to those programs today. I’m surprised that participation rates have tripled over the length of my career, and wonder how my entrance mark observation squares with the partipation rate data.
Hi Mitch. The problem is that grade 12 mark isn’t exactly a stable measure of achievement. Is an 80 from 1990 similar to an 80 today? My guess is not, but it’s a difficult thing to control for.