Recently, I noticed that Statistics Canada has data on the Canadian professoriate dating back to 1970-71. I don’t know if this is a recent addition to the free data scheme or if it’s been there all along and I have never noticed it, but it’s certainly worth a peek.
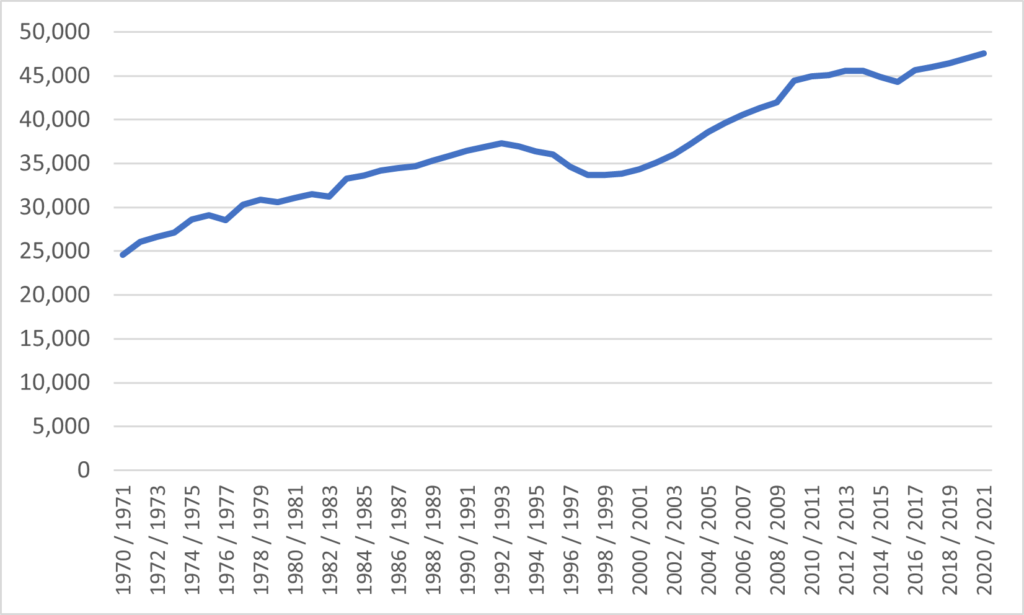
Figure 1 is the simple picture, just total numbers. It’s a pretty simple story: long-term, Canadian higher education has expanded by about 460 full-time academics per year every year since 1970. The exceptions, really, were the period 1993 to 1998, when budget cutbacks in various provinces resulted in quite stringent hiring freezes, and to a lesser extent 2012-2017 when something similar occurred in the aftermath of the Global Financial Crisis.
Figure 1: Full-time Academic Staff at Canadian Universities, 1970-71 to 2020-21
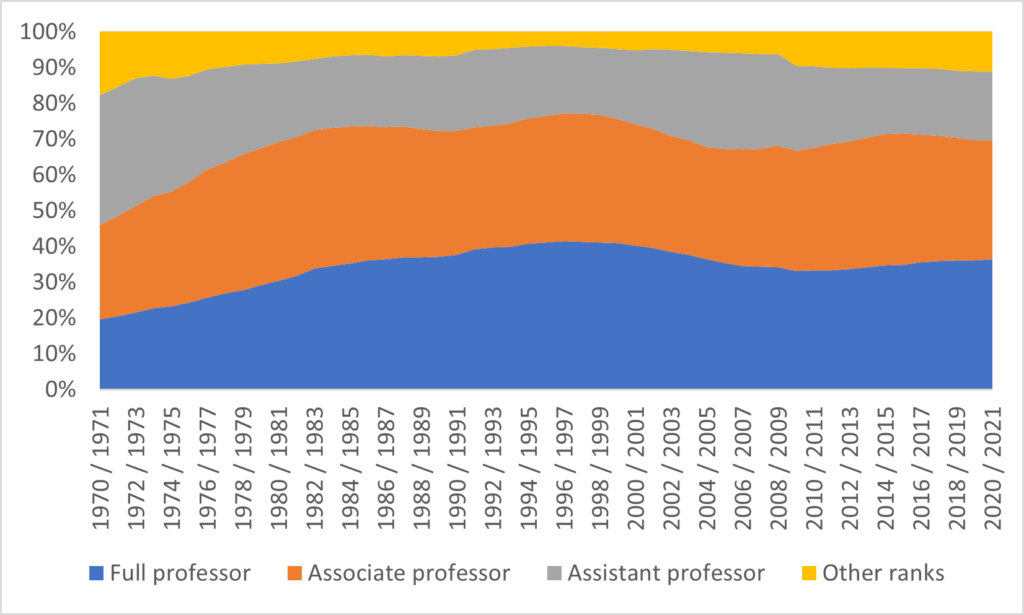
At a very high level, you can get a sense of how the age break-down of the professoriate changed over the years by looking at the distribution of professors by rank. Back in 1970, the professoriate was pretty young: less than one-fifth of full-time academic staff were full-professors, and there were almost twice as many assistant professors as there were full professors. This shouldn’t be surprising: in 1970, somewhere between two-thirds and three-quarters of all professors would have been hired since 1960 or so. But if you then slow the pace of hiring, what happens is a massive reduction in the number of young (i.e. assistant) professors. And this is exactly what we see in the late 1970s, the mid-1990s, and again in the early 2010s: drops in the proportions of assistant professors.
Figure 2: Distribution of Full-time Faculty by Rank, Canada, 1970-71 to 2020-21
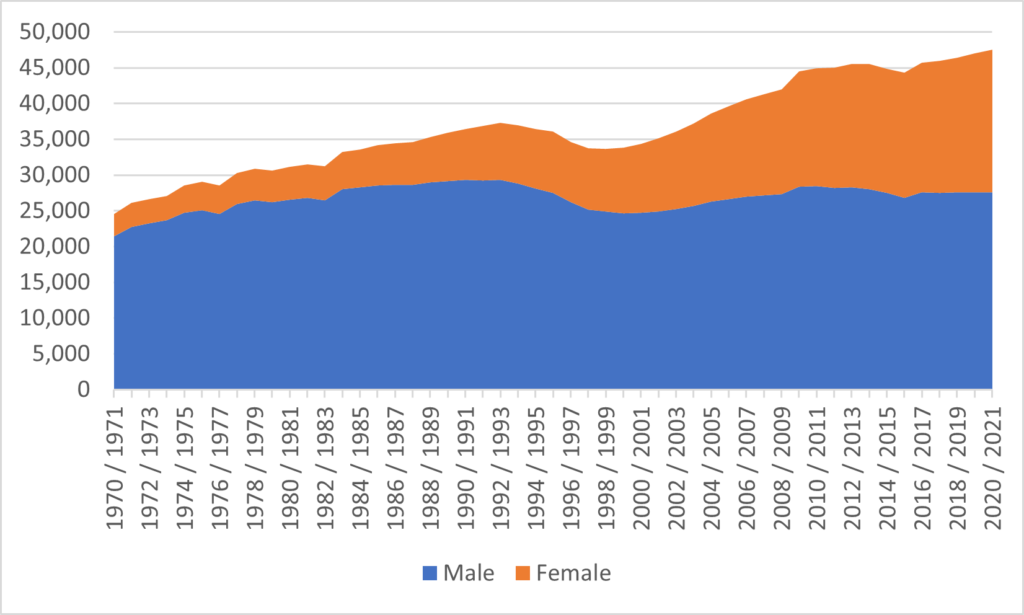
When flipping through the data, I thought the data by gender was the most interesting. Figure 3 shows total academic staff numbers by gender. Intriguingly, male professor numbers peaked in 1992/93, right before the big round of hiring freezes and buyouts that began that year. Since that time, 100% of the net growth in the professoriate has been from women academic staff, who now comprise 42% of the entire professoriate.
Figure 3: Distribution of Full-time Faculty by Gender, Canada, 1970-71 to 2020-21
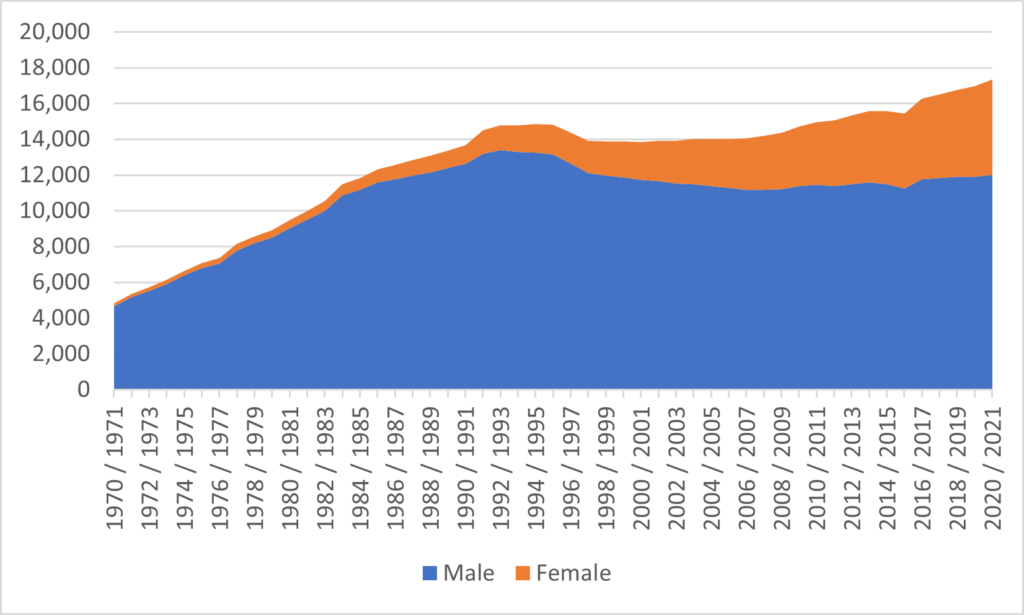
Of course, if you are tempted to think that we are well on the way to gender parity in Canada, it is worthwhile taking a quick peak at the gender data for academic staff by rank. Figure 4, which shows Full professors by gender, shows that at the top ranks of academia there is still a heck of a long way to go.
Figure 4: Distribution of Full Professors by Gender, Canada, 1970-71 to 2020-21
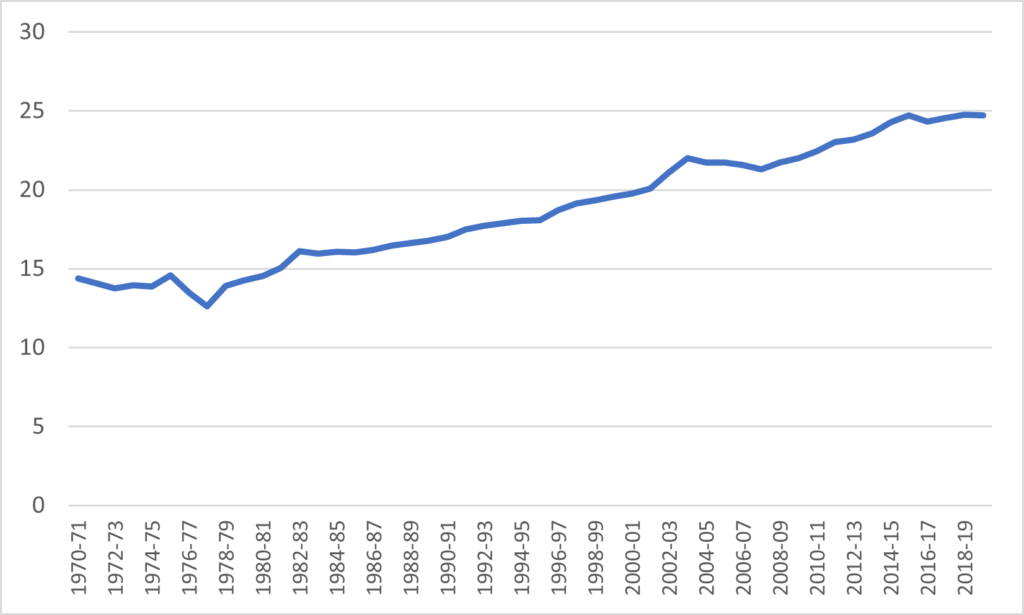
A final way of looking at all this is to compare the growth in faculty numbers to the growth in student numbers, as I do below in figure 5. While faculty numbers nearly double during those 50 years, student numbers increased slightly more than three-fold. As a result, the ratio of full-time equivalent students to full-time academic staff has risen from about 14:1 to about 25:1.
Figure 5: Ratio of FTE Students to Full-time Academic Staff, Canada, 1970-71 to 2020-21
Tomorrow: faculty salary data.

 Tweet this post

To tell the truth, I can say that these statistics were able to blow my mind in some respects and some indicators made me delve into different things, considering them on a more fundamental level. Of course, some of these indicators are quite justified and this tendency can be explicable, but I can’t really understand many aspects and the causal relationship. I can’t find an explanation on the fact that since 1992/93, 100% of the net growth in the professoriate has been from women academic staff, because I want to look at this on a deep level, but it is a little bit strange for me. Of course, such a turn of events are affected by some different factors, but for me it was really sharp. But i can say the fact that student numbers increased slightly more than three-fold from 1970 to 2020 is truly wonderful because it indicates improvement of the sphere of education and our reality.