


Ok, so I got a little bit too excited in yesterday’s blog, when I indicated I could show how the increase in student aid spending since 2006 has improved affordability. I forgot that while I do have aggregate data on grant expenditures across the country, data on how this money is split by institutional type is pretty scarce. The Canada and Quebec student aid programs do publish data like this, but for some reason neither government chooses to leave older statistical documents up on the website, so we only have data for the last few years. As for all the other provinces – forget it. Nothing published.
Still, what we know is that for the Canada Student Financial Aid Program, the proportion of total grants going to university students is somewhere between 55 and 59 percent, depending on the year. In Quebec, it is slightly lower, between about 51 and 55 percent (mainly, I think, because a small proportion of Quebec student aid goes to students in vocational secondary schools). My guess is that the other provinces are probably somewhere in between. So, to make things easy, let’s just say that the proportion of grants going to university students is about 56% in all years since 2006-07. That’s not literally true, but it’s unlikely to be off by more than a couple of points.
So, figure 1 shows us how much total non-repayable aid – that is, grants and loan remission – was paid out to students over the period 2006-07. There has been a huge jump in the last few years. Part of it is due to Ontario’s big policy shift towards targeted free tuition in 2016 (and despite later cuts by the Ford government, Ontario aid spending is still well above where it was pre-2016). The main driver is a major expansion of grants by the Government of Canada, particularly during the COVID epidemic.
Two things should be obvious from figure 1: first is that the total amount of non-repayable aid is way up, and within the category of non-repayable aid, there has been a large shift from remission (which replaces loans at the end of a period of study) to grants (cash up-front).
Figure 1: Total Government Non-Repayable Aid, by Type/Source, 2006-07 to 2020-21, in millions of $2020.

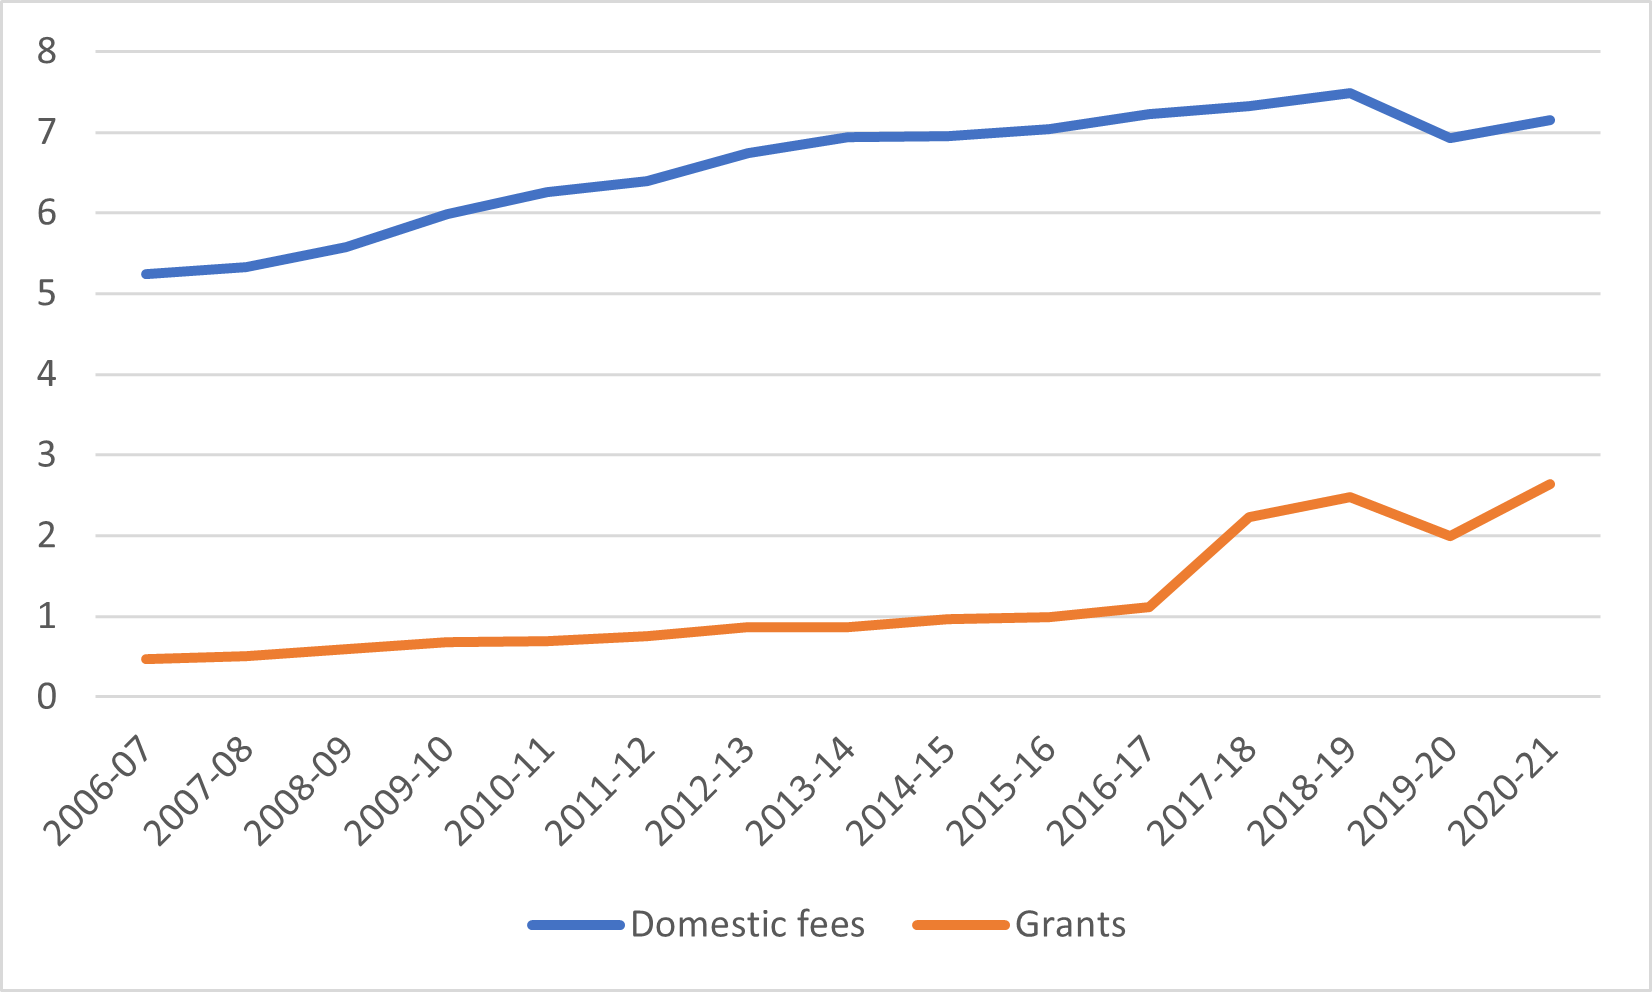
Figure 2 takes the data on grants (not including remission) from figure 1 and multiplies it by 56% to arrive at a figure for total grants for university students. It also shows data on estimated total university fee revenue from domestic students and displays both in billions of real 2020 dollars. In effect, what it shows is that grants covered about 9 cents of every dollar of domestic tuition paid in 2006-07 and by 2020-21 it was covering nearly 37 cents on the dollar.
Figure 2: Aggregate Domestic University Tuition Fees vs. Estimated Aggregate Government Grants for University Students, 2006-07 to 2020-21, in billions of $2020.
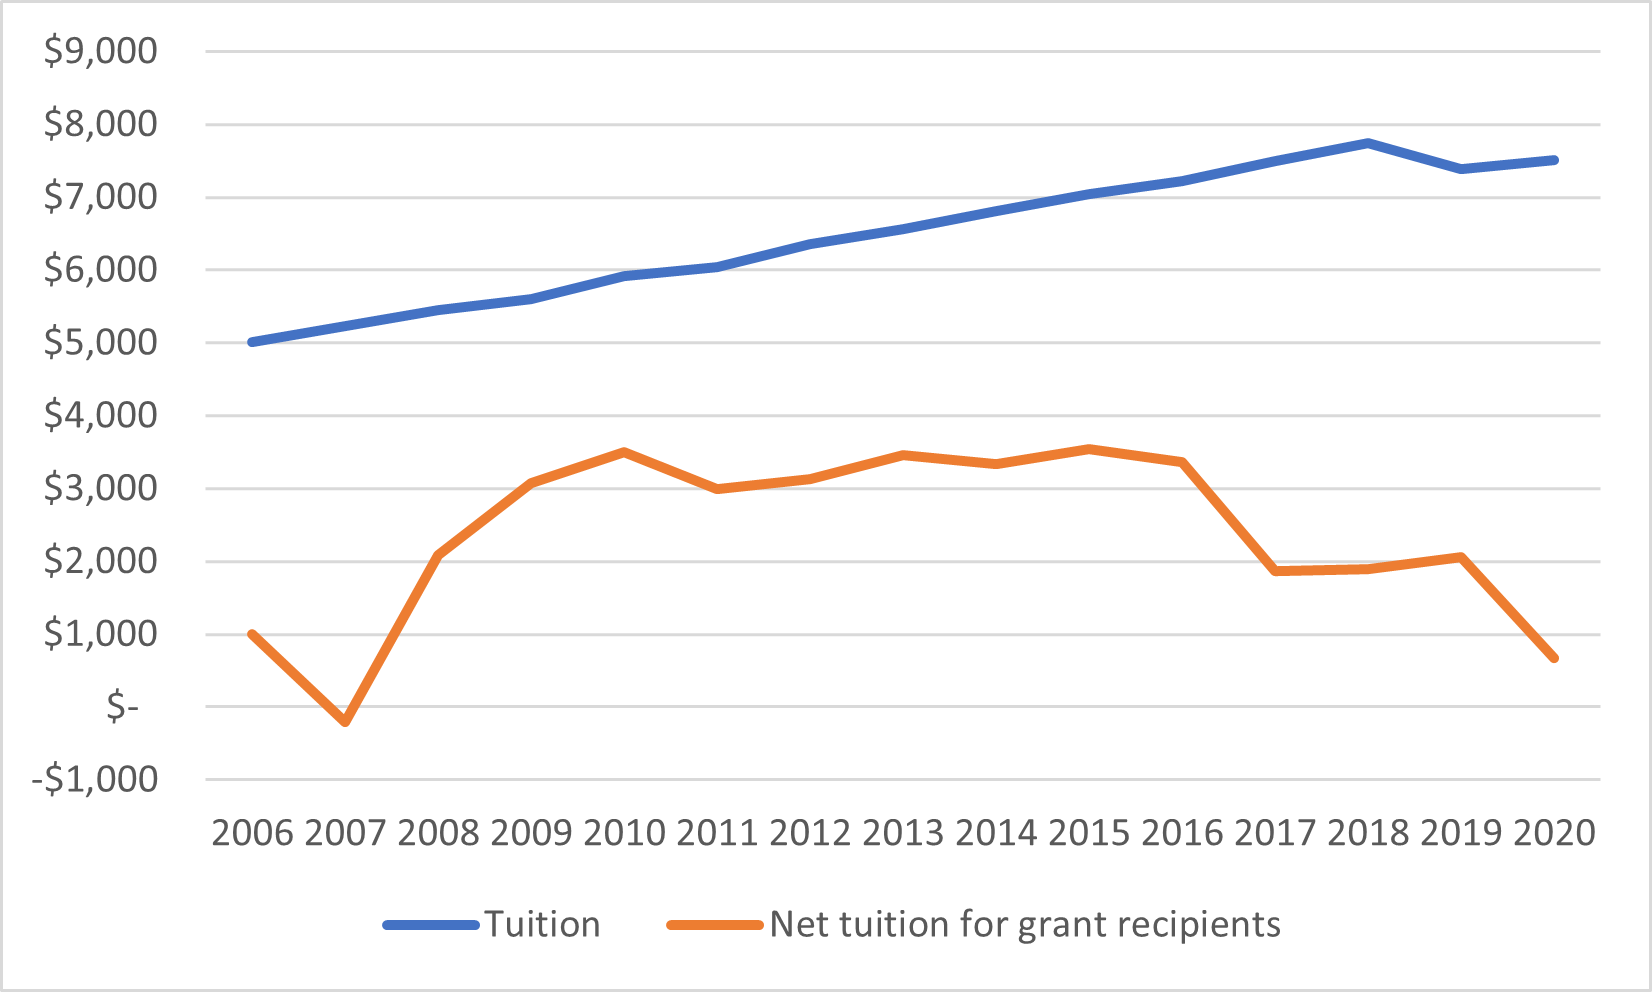
Now we can apply the data in figure 2 to information to the data we used yesterday on tuition fees. In figure 3, the blue line is average tuition, and the orange line is average “net tuition”, or total tuition minus total grants. And what we see here is that recent increases in grant expenditures have effectively wiped out all rises in “net tuition” since 2006.
Figure 3: Average Tuition and Fees vs Average “Net Tuition”, 2006-07 to 2020-21, in $2020.

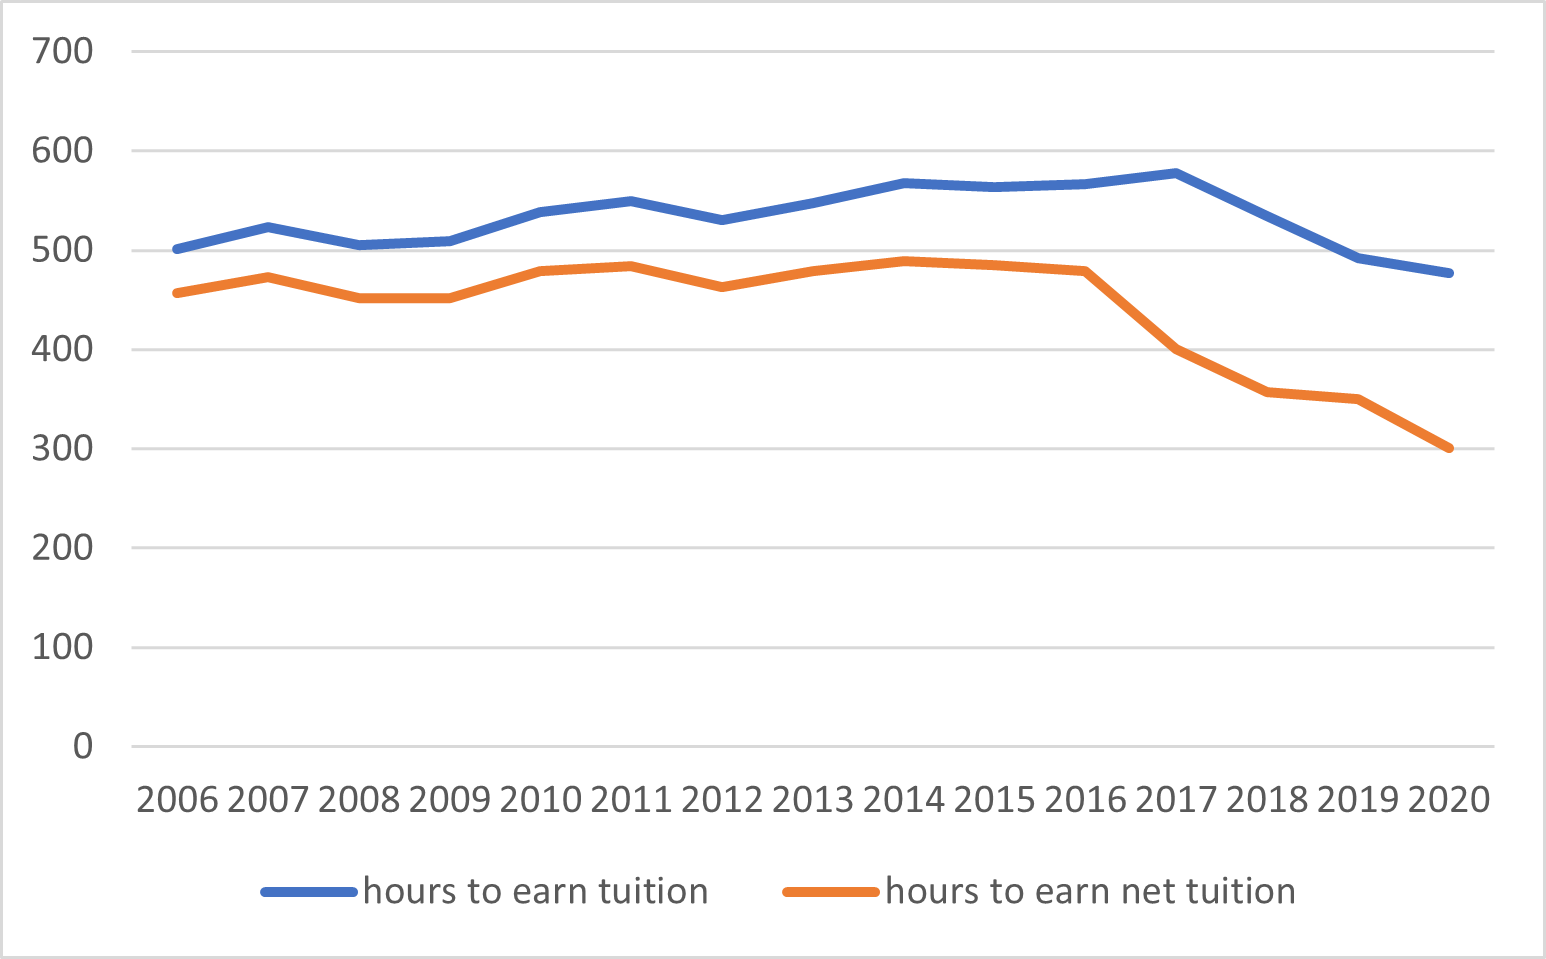
Now, we can extend this by applying young Canadians’ median hourly wages to this new data on average “net” tuition in order to come up with a measure of “affordability” (which, recall, is everywhere and always some measure of price divided by some measure of ability to pay). By this measure, the “price” of net tuition has fallen by 39% from about 490 hours to 301 hours between 2014 and 2020.
Figure 4: Hours Required to pay Average Tuition Fees and Average “Net Tuition Fees” at Median Wage for 15-24 year-olds, Canada, 2006-2020
Now here’s the thing. Figures 3 and 4 are somewhat misleading, because they imply that all students are receiving the same discount from grants, and of course that is not true. Some students receive grants and others do not. For those that do not, there is no difference between tuition and net tuition. For those that do, net tuition is much lower. The problem is that we simply do not have a good handle on how many students receive grants in Canada. We know how many grants are issued each year, but outside Quebec it is quite possible to receive a grant from both the federal and provincial governments, and there is no data available to tell us the number of unique recipients.
To go further requires shifting into back-of-the-envelope mode. We can generate lower- and upper-bound estimates for grant recipients across Canada by simply assuming all federal grant recipients outside Quebec also received provincial grants in the case of the former, and by assuming none do for the latter. For the most recent year where data is available, that makes for a lower bound of about 635,000 and an upper bound of just under 910,000; these figures are up several-fold since 2006-07. Much of the change has to do with some structural shifts in the way aid was delivered when the Millennium Scholarship Foundation disappeared and replaced by Canada Student Grants (tl;dr: some remission got turned into grants and a system which gave large grants to a few people got turned into one which gave smaller grants to a lot more people).
Figure 5: Lower-and-Upper Bound Estimates for the Number of Student Grant Recipients in Canada, 2006-07 to 2020-21

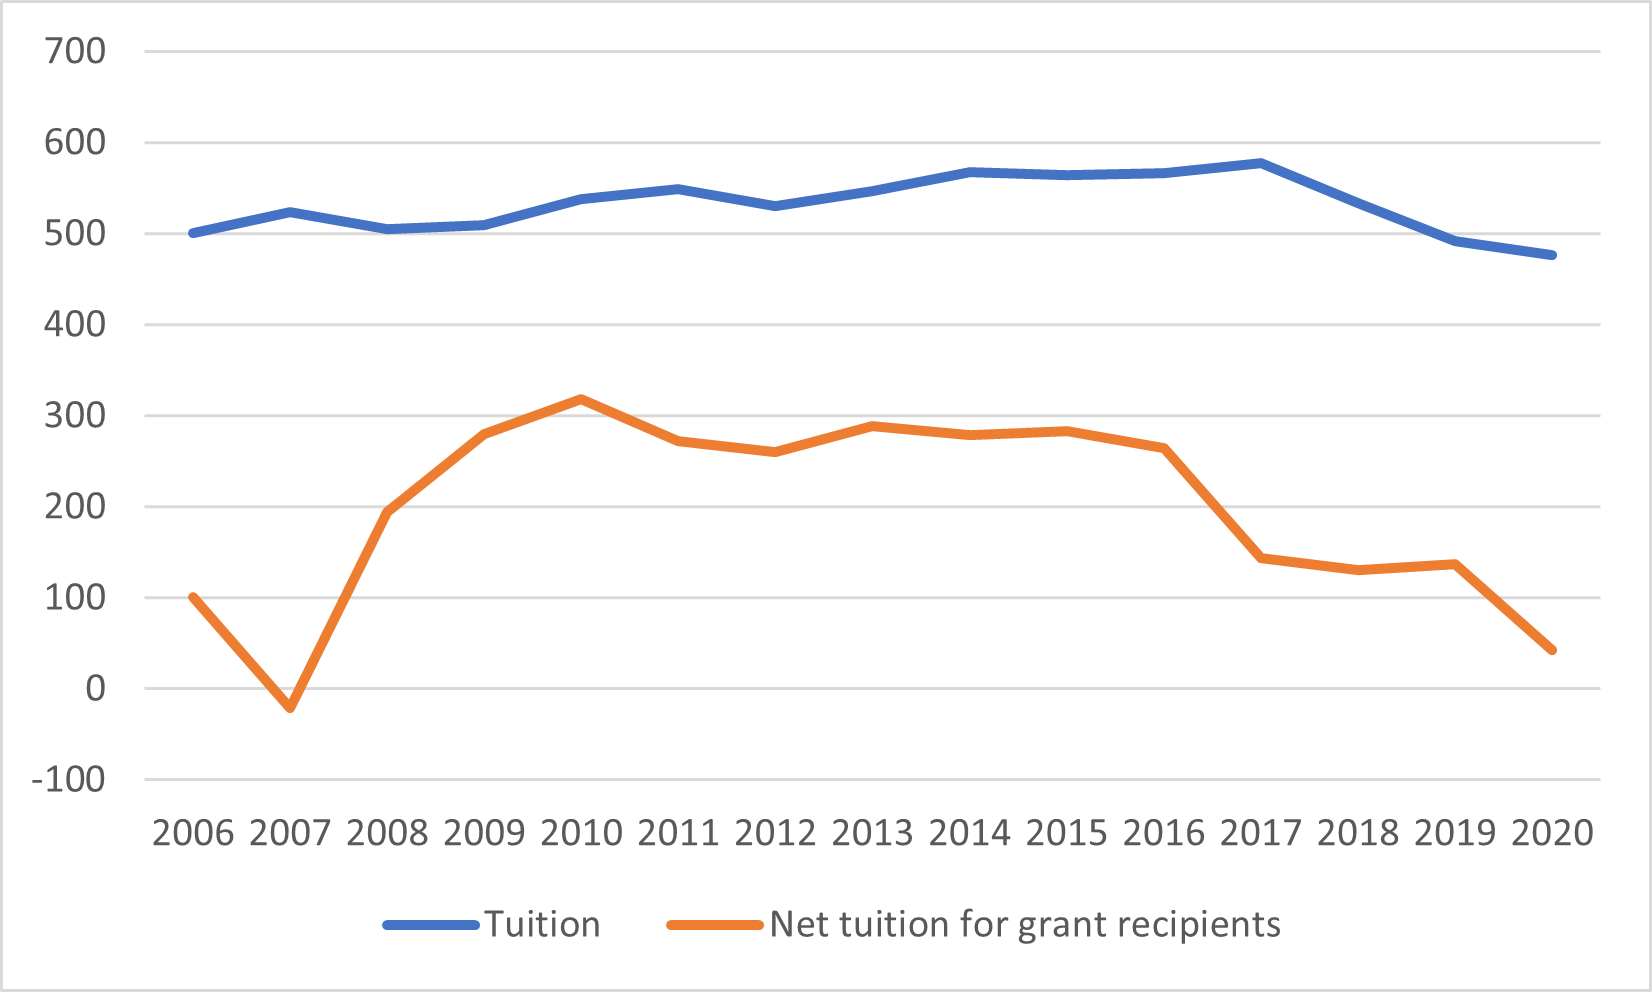
To get a very rough estimate of grant recipients in universities, take the mid-point of the upper and lower bounds to get a total number of grant recipients, and then divide that number in half to get the number of recipients (the proportion of recipients from universities is slightly lower than the proportion of total grants going to university students). Dividing total grants to university students (see figure 2) by this figure, you can get the average grant per student, and by extension, this allows us to calculate net tuition for students who receive grants, which is shown below in figure 6. There are two ways to interpret this graph: if you just look at the last five years or so, what you see is that net tuition for those receiving grants has fallen by 80% or so since 2015. Alternatively, if you take a 15-year horizon, net tuition for those receiving grants is pretty close to what it was in 2006, but (as we saw above) the number of people receiving grants is up about 4-fold.
Figure 6: Average Tuition and Fees vs Average “Net Tuition for Grant Recipients”, 2006-07 to 2020-21, in $2020.
And, for the sake of completion, let’s display those same figures in terms of the number of hours required to work at median income for 15-24 year-olds. The story is very similar: using a short-term lens, hours required to make “net” tuition is down about 85%, and long term it’s around where it was 15 years ago, but to repeat: four times as many students now enjoy these low “net” prices in 2020 than in 2006.
Figure 7: Hours Required to pay Average Tuition Fees and “Net Tuition Fees for Grant Recipients” at Median Wage for 15-24 year-olds, Canada, 2006-2020
I hope this dispels the notion that higher education has become less affordable in recent years. It is quite the opposite. Once higher student aid spending is considered, net fees for grant recipients are under $700, or, under 50 hours of work at the median wage for young workers.

